


BISAC NAT010000 Ecology
BISAC NAT045050 Ecosystems & Habitats / Coastal Regions & Shorelines
BISAC NAT025000 Ecosystems & Habitats / Oceans & Seas
BISAC NAT045030 Ecosystems & Habitats / Polar Regions
BISAC SCI081000 Earth Sciences / Hydrology
BISAC SCI092000 Global Warming & Climate Change
BISAC SCI020000 Life Sciences / Ecology
BISAC SCI039000 Life Sciences / Marine Biology
BISAC SOC053000 Regional Studies
BISAC TEC060000 Marine & Naval
Sea level and wave data at Salalah coast (Oman) were used to simulate nearshore waves and current during the tropical cyclone ARB01 (9 May2002). STWAVE model (Steady State Spectral Wave) was applied for nearshore wave simulation, while M2D model ((Two-Dimensional Depth Averaged circulation model) was used to simulate nearshore current. The results of simulations (taking into account the mutual effects of both current and waves) showed that: The significant wave heights generally decrease from about 6m at the domain boundary to about 1 m close to the coast. The wave heights during the ebb period were higher than that during the flood period by about 1.5m. Along Salalah coast, higher waves were found along the eastern side of the domain. This is because the shielding effect of breakwater, which protect the western part of the coast from high waves. Relatively Strong current with values up to 1.5 ms-1 were found in the nearshore region during both ebb and flood periods. The M2D model results also showed cyclonic circulations during these periods which help in the renewal of harbor waters. Generally, the model results showed good agreements with observations in the investigated area.
Coastal processes, Tropical cyclone, Salalah, Oman.
1-Introduction
Salalah is the capital of the Dhofar region of Oman (Fig1). The city is a popular destination for tourism due to the natural attractions of the al-Qar mountains, and abundant stands of frankincense trees lining mountain stream courses. The beaches and coastline are also major attractions for scuba diving and bird watching. The harbor of Salalah is located approximately 15 km to the southwest of the city. The shoreline is relatively straight extending from the Salalah Port till Marbat headland west of Taqah (Fig1).
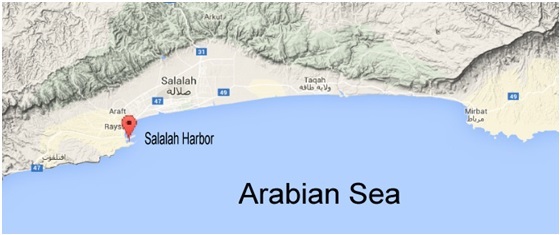
Fig.1.Regional map of Salalah
”Ref[9]” considered the months of July–August as the period of southwest monsoon. However, they point out that sometimes the southwest monsoon starts in the west in June and in the east in May. They considered that the northeast monsoon was restricted to the months of November–February. Other months were considered as periods of weak variable winds. ”Ref [3]” and “Ref[8]” stated that tropical cyclones are seasonal phenomena: most tropical ocean basins have a maximum frequency of cyclone formation during the late summer to early autumn period. This is associated with the period of maximum sea surface temperature (SST), although other factors, such as the seasonal variation of the monsoon trough location, are also important.
The tropical cyclone in the area of the Arabian Sea and the Gulf of Aden considered the main cause of natural disasters on coastal communities and facilities scattered along the coast and caused by strong winds and high waves, high tides and floods resulting from rain associated with such depressions. The 2002 Oman cyclone (officially known as Cyclonic Storm ARB 01) was an uncommon tropical cyclone that struck the Dhofar region of Oman in May 2002. The first storm of the 2002 North Indian Ocean cyclone season, it developed on May 6 in the Arabian Sea, and it maintained a general west-northwest track for much of its duration. The system reached cyclonic storm status on May 9, meaning it attained winds of greater than 65 km/h (40 mph), and on May 10 it made landfall near Salalah; shortly thereafter it dissipated. The storm was rare, in the sense that it was one of only eleven tropical cyclones on record to approach the Arabian Peninsula in the month of May [6].
The storm brought the heaviest rainfall totals to Dhofar in 30 years, causing flooding and creating rivers in wadis, or typically dry riverbeds. Several people drowned after their vehicles were swept away by the flooding. The storm caused locally heavy damage, totaling $25 million (2002 USD).
The aims of the present work are to study waves characteristics and nearshore current along Salalah coast during the Cyclonic Storm ARB-01(May, 2002) by using two Coastal Modeling System (CMS Flow and CMS Waves). These models have been tested in many coastal regions and their results have shown good agreements with observations. “Ref [4]”, “Ref [5]” and” Ref [2]” have used CMS-Wave to simulate a nearshore spectral wave processes model for coastal inlets and navigation projects. ”Ref [1]” illustrated that CMS-Wave can be coupled to CMS-Flow a hydrodynamic and sediment transport model, to calculate the sediment transport and morphology change forced by combined action of tides, currents and waves.
2.Data and Methods of Analysis
The data used in the present work are: the bathymetric data of the investigated area (Fig.2), which are obtained from the CMAP(http://c-map.jeppesen.com/). The meteorological, and hydrodynamic conditions (during two tidal cycle (24hour) at the time of cyclone on 9May-2002, Salalah) were obtained from (ODGAM) Omani Directorate General of Aviation and Meteorology and UH Sea Level Center (UHSLC). The wave conditions (significant wave height and period) in offshore of study area are hindcasted using wavelab Software Package (http://www.hydrosoft.civil.aau.dk/wavelab/) depending on SPM semi-empirical method for wave hindcasting. It is based on JONSWAP spectral method that presented in shore protection manual [10].
In the present work the simulations were done on May 9, 2002 at Salalah-Oman with model domain about (13x9 km). The input wind speed was 26m/s, direction=130° duration of wind=24h; and fetch=400km. At the southern boundary of the model’s domain (Fig. 3) wave conditions were: Hs=8m, Tp=13.6 s and direction=130°, and mean tide=1m; at a depth=50m.
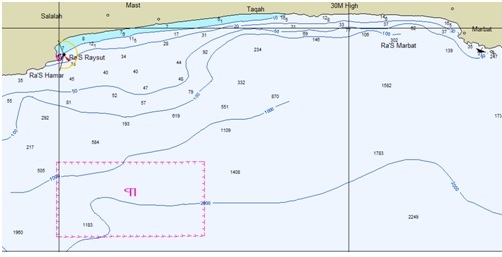
Fig.2. Bathymetry off Salalah coast.
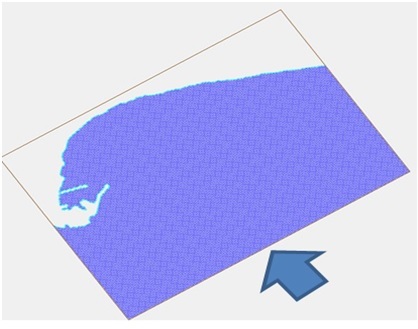
Fig.3.The Model Grid
The CMS-Wave and CMS-Flow are a component of the Coastal Modeling System developed by the US Army Corps of Engineers Coastal and Hydraulics Laboratory. CMS-Wave is a spectral wave transformation model that employs a forward-marching, finite-difference method to solve the steady-state wave-action balance equation on a non-uniform Cartesian grid [7]. It considers wind wave generation and growth, diffraction, reflection, dissipation due to bottom friction, white capping and breaking, wave-wave and wave-current interactions, wave runup, wave setup, and wave transmission through structures [4], while CMS-Flow is a two-dimensional, finite-difference numerical approximation of the depth-integrated continuity and momentum equations.
Steering model refers to the coupling process between CMS-Flow and CMS-Wave. CMS-Wave can be run as a stand-alone model or in coupled mode with CMS-Flow. The coupled flow-wave mode is handled in the SMS Steering Module under the Data menu to calculate the interactions of tides, currents and waves. In the Steering mode, CMS-Flow provides the water level and flow field input data to CMS-Wave. Wave height, period, direction, and radiation stress components calculated by CMS-Wave are input to CMS-Flow [5] .CMS-Wave was coupled with CMS-Flow on the same grid. CMS-Wave, which was run in a steering mode with the 6-hr interval with CMS-Flow to account for the influence of waves with current and tides.
3. Results and discussions
Observations
The wind regime at Salalah is characterized by two activity monsoon: the winter monsoon is marked by the occurrence of the north to northeastern monsoon from November to February with percentage of up to (40%) during some month and wind force up to (10m/s). Most values of wind speed during this season occurred in the interval between (2 to 4 m/s) with highest occurrence approaching (40%). Through summer monsoon (May-August), winds are blowing from south west during June, and persists till September with dominant winds from south to southwest directions with percentage of up to 50-70%. There are significant increases in wind force during this season with values of more than10 ms-1 during some days of this season.
Analysis of Meteo-Marine conditions during the cyclonic storm ARAB1(May 6 to May 11, 2002) were characterized by significant temporal fluctuations. On May 10, 2002 at 0600 UTC, the atmospheric pressure dropped to a minimum value of 999 hP and the sea level raised significantly by about 4m above the mean sea level (1.32 m above the zero instrument level). Although the predominant wind during this period blew from the SSW, the strong winds (> 12 m/s) were from the ENE to SSE. The maximum wind speed of about 20 m/s (Fig.4) was observed to come from ENE direction and was also recorded on May 10 at 0600 UTC.

Fig4. Time series of: a-wind speed, b-significant wave period, c-Max wave height ad-Significant wave height during ARAB01(May 6,2002 to May 11,2002 at 2300 UTC)
Generally, waves generally approach Salalah coast from the North (clockwise) to SW direction, but they predominantly approach the coast from the east and southwest directions. High waves with significant wave height of more than 4.0m approach the area from ENE direction. During the tropical cyclone Arab01, the maximum wave height of about 7m was recorded on May10 at 0600 UTC, at the same time, the significant wave height, attained its maximum values of 4.5 m. Waves approaching Salalah coast generally have periods (Ts –sig. wave period) of less than 12 seconds and most of them have periods between 2-4 seconds. Waves with periods > 8 seconds were noticed to approach Salalah coast from ENE to SSE directions. On May 10 at 0600 UTC, when the storm attained its maximum strength the longest period waves (Ts =11.82s) were observed (Fig.4).
Models Results
Coupling process between CMS-Flow and CMS-Wave was done taking into accounts the effect of waves, currents and tides. Analysis of models simulations showed that:
Wave height varied between 8 m at the domain boundary and 1 m close to coastline (Fig.5). Generally, the wave height at first decreases shoreward and then it increases on approaching the breaking zone. Along a coastline, the wave height varied between 0.5m at the western side and 3.5m along the eastern side. Diffraction and refraction of wave with small values of wave height appeared on the western side of Salalah area in the commercial fish ports, because the shielding effect of breaker water which protects the area from the high waves outside.
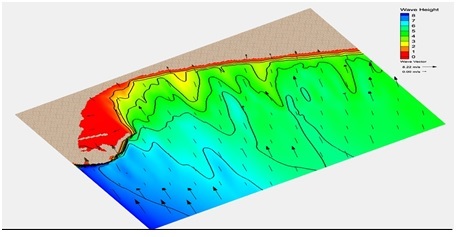
Fig.5. Wave height (m) and direction using CMS-Wave model on 9May-2002, at Salalah
Wave breaking off Salalah coast generally occurred at a depth of less than 4m (the bright green color in Fig.6). The breaking areas extend a distance between 200 and500m away from the shoreline, except at the western part area due to the breaker water that protects the harbor. During the flood periods, wave breaking occurs generally at smaller distance from the shore than in the case during the ebb periods.
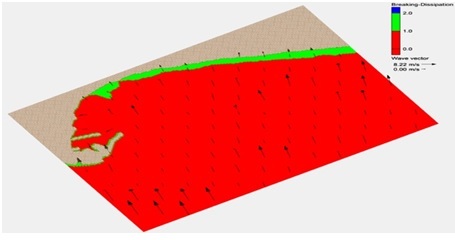
Fig.6.Breaking and dissipation areas.
The wave height during ebb period is higher than during the flood period(Fig.7) by an amount of up to 1-1.5m. Generally, over most area of the model’s domain, the higher values of wave height occurred in the shallow nearshore region. Strong currents with values of up to 1.45m/s were observed in the nearshore region during ebb and flood period. Longshore currents were observed near the shoreline during flood period, while during the ebb period it is occurred away from the shoreline by a distance of about 4km, because the wave breaking occurred close to the shore during the flood and far from the shore during ebb period.
The convergence of longshore current noticed in the central and the eastern parts of the area affect sediment transport and leads to changes in morphology of these region. Accretion will be formed in these convergence regions. A cyclonic circulation was noticed in Salalah harbor during ebb and flood period causing renewal of harbor’s water. Currents with values of up to 1, 1.5m/s directed in and out the harbor will lead to sediment exchange between the harbor and it’s surrounding area. The current regime in the western side of the area may lead to accumulation of sediment inside the harbor particularly near the inner jetty (Fig.7).
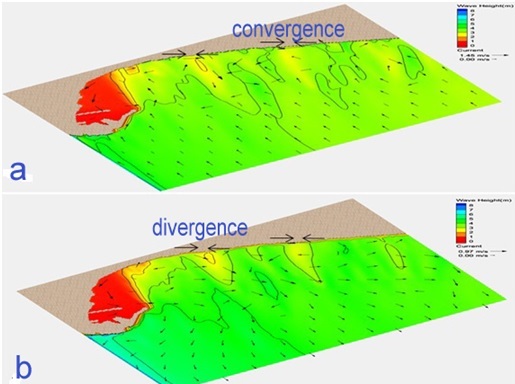
(Fig.7): Current vectors(m/s) and wave height (m) contours at Salalah (May 9,2002) during a. Ebb period, b. Flood period (boundary conditions: Hs = 8 m, Tp=13.6 sec, dir=130, tide = 1 m mean tide level).
Generally, the simulation of linked CMS flow and Wave models gave results on the nearshore currents and sea waves conditions along Salalah coast which are in good agreement with meteo-marine observation in Salalah region
4-Conclusions
The wind pattern at Salalah is varied between North direction during NE monsoon (November-February) and south to southwest direction during SW monsoon(May-August). The wave height varied between 8 m at the boundary domain and 1 m close to coastline. The wave height during ebb period is higher than during the flood period by an amount of up to 1-1.5m. Along a coastline from west to east the wave height varied between 0.5m at the western side and 3.5m along the eastern side. Diffraction and refraction of wave with small values of wave height appeared on the western side of Salalah area, because the shielding effect of breaker water which protects the area from the high waves outside. Wave breaking off Salalah coast, generally, occurred at depth of less than 4m. The breaking areas during ebb and flood times are located at a distance between 100 to 500m and at depths between 1-4m.
Longshore currents observed near the shoreline during flood period and away from the shore at a distance of about 4km during ebb period. The convergence of longshore current seen in the middle and eastern part of the area affect sediment transport and leads to changes in morphology and caused accretion of these regions. Strong currents with values of up to 1.45 m/s were observed in the nearshore region during ebb and flood period. A cyclonic circulation was observed in Salalah harbor during ebb and flood period causing renewal of harbor water. Finally, accretion processes will be happening at convergence area of longshore current otherwise, the erosion processes will be occurred at divergence area.
1. D