


Россия
Россия
BISAC NAT010000 Ecology
BISAC NAT045050 Ecosystems & Habitats / Coastal Regions & Shorelines
BISAC NAT025000 Ecosystems & Habitats / Oceans & Seas
BISAC NAT045030 Ecosystems & Habitats / Polar Regions
BISAC SCI081000 Earth Sciences / Hydrology
BISAC SCI092000 Global Warming & Climate Change
BISAC SCI020000 Life Sciences / Ecology
BISAC SCI039000 Life Sciences / Marine Biology
BISAC SOC053000 Regional Studies
BISAC TEC060000 Marine & Naval
The main objective of this paper is an analysis of the impact of the frequency distribution of wave energy on the dynamics of bottom sediment suspension as well as a study of the features of bottom sediments suspension during the passage of waves groups of varying shape and intensity. It is shown that the concentration of wave energy in the primary spectral peak promotes redistribution vertically suspended solids. Laws of suspension within the group are largely determined by the parameters of bottom roughness and the presence (absence) of ripples.
acoustic backscatter, group structure, suspended sediments.
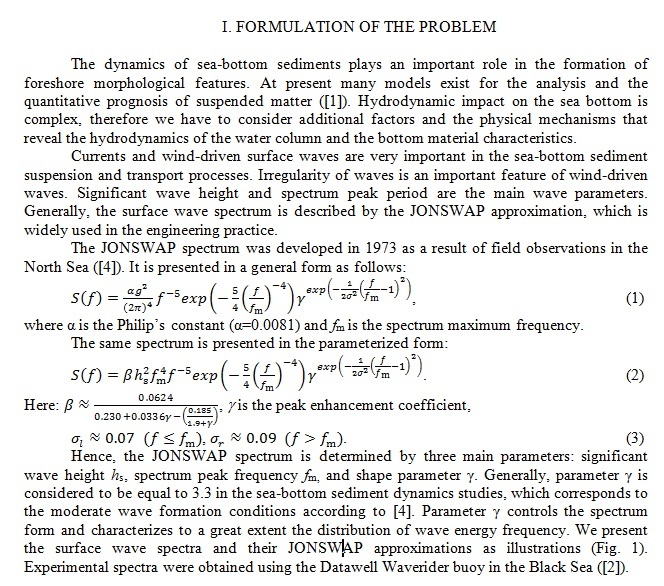
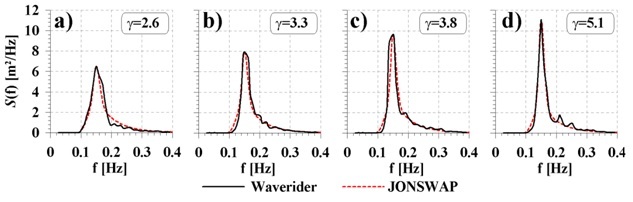
Fig. 1. Wind-driven wave experimental spectra and their approximations by the JONSWAP spectrum
In the spectra shown here, the significant wave height is approximately 2.6 m, while the spectrum peak frequency is 0.15 Hz. Their spectral energy densities are almost equal; however, there are differences in the frequency distribution of the spectral energy. The wave energy concentration in the main peak of the irregular wave spectrum occurs due to the increase in the γ parameter. We put forward the following question: whether this fact influences the regularity of the suspension process and sea-bottom matter deployment? Thus, the principal goal of this work is to investigate whether the suspension processes and sea-bottom matter redistribution are affected by irregular surface waves with constant integral characteristics (the same values of significant wave height and spectrum peak frequency) and the variable frequency distribution of the spectral wave energy (variable value of parameter γ).
It should be pointed out that the influence of the frequency distribution of wave energy in the surface wave spectrum on the sea-bottom sediment transport has been poorly investigated. The question of the possibility of such an influence was first put forward in the paper by [3], while some preliminary results were obtained in the paper by [5].
II. BASIC DATA
The data of laboratory research of integrated experiment conducted in 2008 jointly by Russian and German scientists in the Large Wave Channel Coastal Research Center at the University of Hanover, Germany are the starting materials for this study. Despite some convention, experiments performed in the laboratory, allow to define, manage, and play with the external parameters of the hydrodynamic environment. Big wave channel is the largest in Europe and allows to put large-scale scientific experiments for the study of dynamic processes of coastal zone. The channel dimensions are: length - 307 m, width - 5 m, the total depth - 7 m. Software controlled wave producer generates surface waves with prescribed statistical and spectral properties. Under the conditions of the experiment the bottom is a layer of sand thickness of 0.82 m. The instrumentation was located at a distance of 111.45 m from wavemaker. The initial depth at the place of measurements was 3.18 m (Fig. 2).
The parameters of surface waves were recorded with string wavemeters; the sensor frequency response was 40 Hz. At a distance of 0.75 m from the initial position of the bottom acoustic backscatter sensors (ABS) Aquascat 1000 was placed; the working frequency of 1, 2, and 3.84 MHz were used. The apparent advantage of laboratory experiments is the possibility of defining irregular waves with controlled parameters and certain spectral structure.
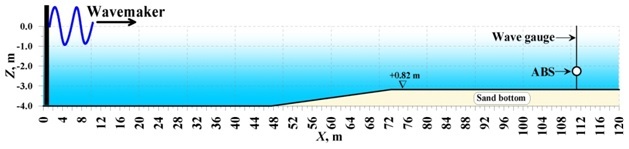
Fig. 2. Deployment of the equipment in the experiment Hannover’2008
As a source of irregular wave field the set of free surface elevations sequence having JONSWAP-spectra with desired characteristics and random phases was used. JONSWAP spectrum is determined by three main parameters: significant wave height Hs, the spectrum peak frequency fp, and its shape parameter g. In our case, a series of experiments conform to the sorting of the spectral parameters of the initial wave field:
• significant wave height Hs = 0.8, 1.0, 1.2 m;
• spectrum peak period Tp = 5 c;
• shape parameter g = 1.0, 1.5, 2.0, 2.5, 3.0, 3.3, 4.0, 6.0, 8.0, 9.9.
Thus, totally, at the considered step of investigation 30 sets of observations of the dynamics of suspended matter under the influence of an irregular surface waves were carried out. ABS processing result data were arrays containing information about the concentration of suspended sediment and average suspended particle diameters in the water column as well as the position of the bottom that was marked as a sharp increase in the detected echo signal.
II. DISCUSSION
Sea-bed dynamics
Acoustic transducers make possible detecting the location of the hard sea bottom, which is determined as the point on the vertical profile with sharp echo signal intensification. The transformation of the sea bottom in the course of the experiment is shown in Fig. 2.
The data used to plot Fig. 3 were smoothed by a low-frequency filter to demonstrate the general trend in the depth variation under the acoustic transducers. According to the conditions of the experiment, the 30-minute consecutive observation series corresponded to the specified initial spectral parameters of the surface wave (g=1, hs=0.8 m), (g=1, hs=1.0 m), (g=1, hs=1.2 m), (g=1.5, hs=0.8 m), (g=1.5, hs=1.0 m), …, (g=9.9, hs=1.2 m). Usually, sea-bottom fluctuations were smaller than 2-3 cm during the time period of each series. Nevertheless, an increase in the deformation of one sign (erosion or accumulation) indicates that significant potential sea-bed displacements are possible.
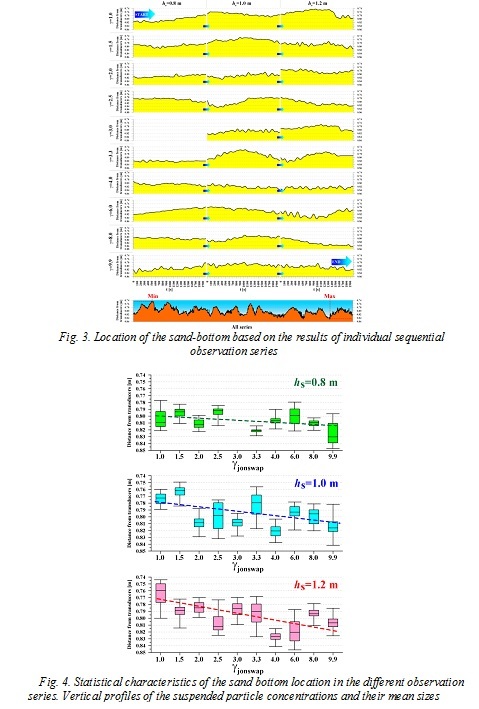
The statistical values of the estimates of the sea bottom location depend on the parameters of the initial wave field (median of the distribution, 25% and 75% quintiles, minimum, and maximum) shown in Fig. 4.
Irregularity of the accumulation processes and sea-bottom matter erosion are the consequences of the surface wave influence on the eroded sea bed. For example, according to Fig. 3, the experimental set with parameters [hs=0.8 m, g=6.0] is characterized by substantially permanent sand accumulation, at the point of observation; erosion consistently dominates in the conditions of parameters [hs=1.0 m, g=6.0]; while permanent alteration of the sea-bottom deformation mark takes place in the case of the set of parameters [hs=1.0 m, g=4.0]. At the same time, statistical data processing allowed us to reveal regularities in the sea-bottom configuration variations. It follows from Fig. 4 that when parameter γ increases an obvious trend in local erosion intensification can be clearly seen.
Let us estimate how important the differences in the vertical distributions of the suspended particles are when a surface wave propagates over the eroded sea bottom. Thirty observations of free surface elevations were recorded using a string wave recorder with specific sets of the spectral parameters (hs, fp, g) at an observation point (111.45 m from the wave generator). The duration of each record was 2200 s. Since the records cover the period from the start of the wave generator operation up to the actual decay of the waves, we considered truncated records (from 50 to 2030 seconds) with duration of 1980 s. The profiles of the suspended particle concentrations and the profiles of the mean sand sizes for the observation sets from hs=1.2 m, fm=0.2 Hz, and the variable time-averaged γ parameter are shown in Fig. 5.
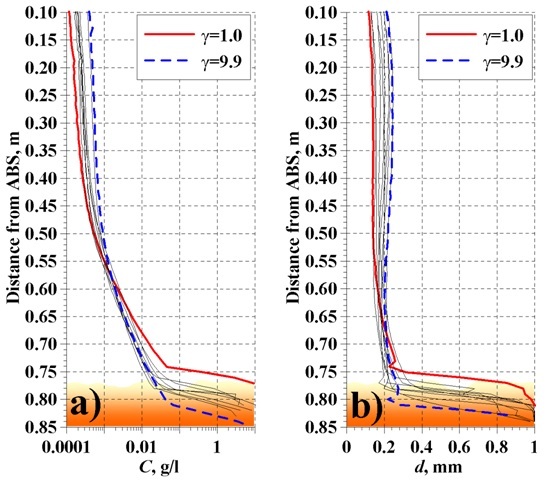
Fig. 5. Vertical profiles of concentration (a) and mean diameter of suspended particles (b)
Actually, the near-bottom averaging is not informative because the transformation of the sea-bottom profile is very strong. Correspondingly, the region in Fig. 5 with light brown colour generally shows the sea-bottom. It is seen from Fig. 5 that the vertically suspended particle field becomes more homogeneous as the γ parameter increases. A decrease in the mean particle diameters by vertical is related to the low γ value. The grain-size composition does not change strongly above the sea bottom when the peak parameter increases. Large values of the mean diameter (d50) in the erosion layer may appear owing to the influence of the physical factors (erosion of light fraction) as well as due to the uncertainties in the interpretation of the reflections of the acoustic signal.
Suspension of the bottom sediment by passing wave groups
The geometrical characteristics of waves groups affecting the bottom sediment suspension are the following: the height of individual waves, forming the group; position of maximum wave within the group (spatial asymmetry); the number of waves in the group (group length).
Based on the geometrical characteristics four types of groups are allocated:
• 1 - positive horizontal asymmetry (maximum wave at the beginning of the group);
• 2 - negative horizontal asymmetry (maximum wave at the end of the group);
• 3 - symmetric (maximum wave in the middle group);
• 4 - constant (wave height in the group are almost identical).
Example of waves groups types allocation shown in Fig. 6.
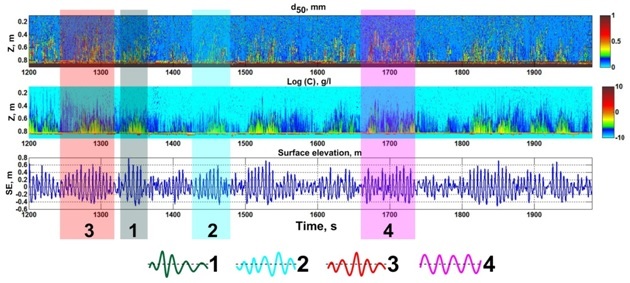
Fig. 6. Wave groups types and the corresponding instantaneous values of the average particle diameter and the concentration of suspended sediment
Type of wave groups and the length of the group (the number of waves in the group) are determined in the process of redistribution of bottom sediment in the water column. It should also be borne in mind that certain difficulties processes of suspension by various groups comparing are associated with objective physical factors, such as differences in the characteristics of the wave (including the amplitude of the wave velocity), as well as differences in the lengths of the compared groups.
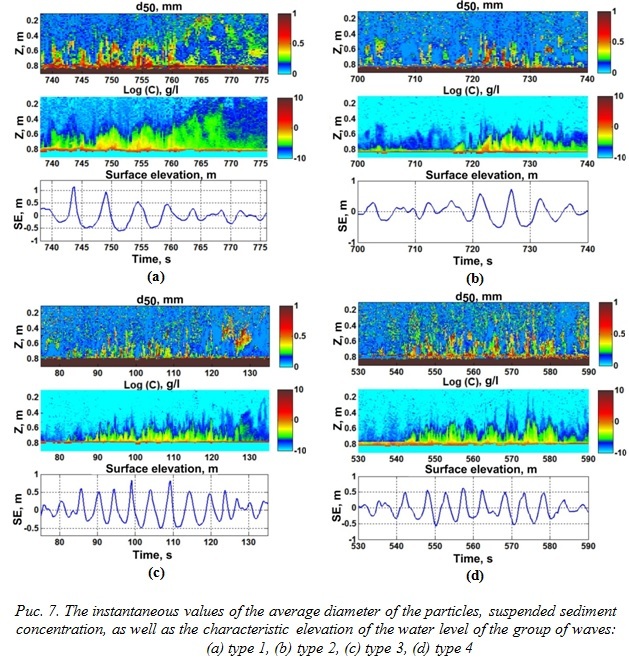
The characteristic pattern of redistribution of suspension under the influence of waves of different geometry groups are shown in Fig. 7.
Analysis of experimental data revealed the common to all groups suspension patterns, and differences in the dynamics of suspended material:
- Common features. The instantaneous concentration at the forefront of the waves group envelope of the free surface elevation is less than average, averaged over the group. The solitary waves, forming a group are responsible for the suspension during the initial stage. With the passage of waves group instantaneous concentrations in the upper layers begin to be comparable to the near-bottom values.
- Differences. The vertical distribution of suspended sediment concentration closest to the exponential during the passage of a wave group of type 3 with a symmetric spatial form. The passage of waves groups of type 1 delivers the bottom sediment to higher levels from the bottom and forms a more uniform field of suspended sediment.
The vertical distribution of the average particle diameter and normalized concentrations of suspended sediment, specific to different types of wave groups is shown in Fig. 8.
The fulfilled research allowed to draw some conclusions:
• the initial process of suspension within the boundary layer occurs on the scale of single waves. Redistribution in the water column - in the scale of wave groups;
• patterns of suspension within the wave group are mainly determined by the parameters of bottom roughness and the presence (absence) of ripples;
• in the case of symmetrical wave group passing with the same characteristics of individual waves for the first and second halves of the group the concentration of suspended sediment in the second half of the group always is more than in the first one;
• there may be situations when the result of the passage of a wave group the concentration of suspended sediment in the wave boundary layer is reduced. This mechanism is implemented in the event of restructuring bottom microforms, namely erasing steep ripple and reduce the vortex shedding effect in the lee of the ripples;
• An important factor is the energy characteristics of the groups. In the case of weak surface waves the concentration of suspended sediment during the passing the wave group of type 2 is greater than during the passing the wave group of type 1, and under the influence of more strong waves the situation is reversed. This is due to differences in horizontal wave velocities and, consequently, different characteristics of roughness of the bottom.
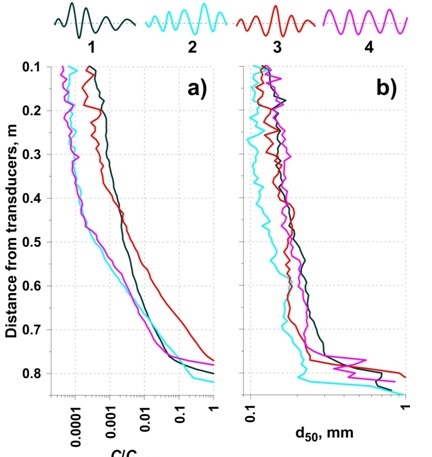
Fig. 8. The vertical distribution of the normalized concentrations of suspended sediment (a) and an average particle diameter (b) for different types of wave groups
Thus, the suspension of the bottom sediment under the influence of different wave groups is characterized by a complex character and is determined by a combination of hydro and lithodynamic factors: the power of waves, wave sequence in the group, the length of the groups, the size and stability of bottom relief forms.
IV. CONCLUSION
- We conclude that if the integral characteristics of irregular surface waves are the same (hs, fm=const) the wave forcing applied to the sand bottom is determined precisely by the frequency distribution of the wave energy. Wave energy concentration within the spectrum maximum frequency band facilitates the transition from irregular to regular waves and generally to the regular dynamic forcing applied to the sand bottom. Physically, this leads to the realization of more stable external conditions for the development of the bottom microforms of the sea-bottom topography.
- The suspension of the bottom sediment under the influence of wave groups is characterized by a complex character and is determined by a combination of hydro and lithodynamic factors: the power of waves, wave sequence in the group, the length of the groups, the size and stability of bottom relief forms. The initial process of suspension within the boundary layer occurs on the scale of single waves. Redistribution in the water column - in the scale of wave groups. Regularities of suspension within the wave group are mainly determined by the parameters of bottom roughness and the presence (absence) of ripples.
The results obtained here are not final but they show that further studies should be related to the analysis of the influence of frequency distribution of surface wave energy on the dynamics of sea-bottom sediment.
V. ACKNOWLEDGMENTS
This work was initializated by the Russian Foundation for Basic Research (Project 14-05-00040). The processing of experimental data was supported by the Russian Science Foundation, project no. 14-17-00547. The calculations and analysis of the results were supported by the Russian Science Foundation, project no.14-50-00095.
1. Davies A.G., van Rijn L.C., Damgaard J.S., van de Graaff J., Ribberink J.S. 2002. Intercomparison of research and practical sand transport models. Coastal Engineering 46, 1-23.
2. Divinsky B.V. 2003. Results of wave measurements near Gelendzhik, in: Kosyan R.D., Podymov I.S., Pykhov N.V. (Eds.), Dynamic processes in a coastal zone. Moscow, pp. 70-91. (in Russian).
3. Grüne, J., Kos’yan, R., Oumeraci, H., Podymov, I., Schmidt-Koppenhagen, R., Vincent, C.E. 2007. Large-Scale Laboratory Modeling of Suspended Sand Concentration Fluctuations under Irregular Waves. Coastal Sediments 07. ASCE, New Orleans.
4. Hasselmann K. et al. 1973. Measurements of Wind-Wave Growth and Swell Decay during the Joint North Sea Wave Project (JONSWAP). Erganzungsheft zur Deutschen Hydrographischen Zeitschrift Reihe. A (80), Nr. 12. Deutsches Hydrographisches Institut, Hamburg.
5. Kos’yan R., Grüne J., Divinskiy B., Podymov I., Vincent C., Ahmari A., Oumeraci H. 2010. The dependence of suspended sand concentration on the degree of storm development. 32nd International Conference on Coastal Engineering ICCE2010, 30 June - 5 July, Shanghai, China.