


Россия
BISAC NAT010000 Ecology
BISAC NAT045050 Ecosystems & Habitats / Coastal Regions & Shorelines
BISAC NAT025000 Ecosystems & Habitats / Oceans & Seas
BISAC NAT045030 Ecosystems & Habitats / Polar Regions
BISAC SCI081000 Earth Sciences / Hydrology
BISAC SCI092000 Global Warming & Climate Change
BISAC SCI020000 Life Sciences / Ecology
BISAC SCI039000 Life Sciences / Marine Biology
BISAC SOC053000 Regional Studies
BISAC TEC060000 Marine & Naval
Results of the suspended sediment concentration study in the coastal zone on the basis of field and laboratory experiments are analyzed. Data from field experiments, performed in the coastal zone of the North, Mediterranean and Black seas, are used. The laboratory researches were fulfilled in the Big Wave Channel of the Hannover University. It is shown that to increase the accuracy of measurement it is necessary to take into account the convective mechanism of the sediment suspension, as well as the size, the direction of the rotation axis and other parameters of the turbulent vortices transporting sand sediments. The presented information will help to improve the quality of field data collection.
suspended sediment, field investigations, turbulent vortex.
I. Introduction
Sediment transport data are necessary for prediction of the coastal erosion, the transformation of the beach and coastal ecosystems and the hazards to industrial and social facilities. Due to difficulties in making measurements in real marine conditions, the quantitative assessment of sediment distribution in the coastal zone has been done by modelling with empirical parameters. However, at present there are no mathematical models that are sufficiently reliable for the prediction of spatial-temporal variability of suspended sediment concentration in the near shore zone where the most intensive suspension and sediment transport takes place. Study and modelling of the physical regularities of the sediment suspension is impossible without field experiments. Field [1, 2, 3, 4] and laboratory [5, 6] research fulfilled earlier has shown that fluctuation component is very important in the formation of resultant flow of suspended sediments. Field and laboratory experiments have shown the necessity of taking into account an oscillatory motion of water and suspended sediment concentration at different levels from the bottom [2, 5, 6, 7]. Now detailed knowledge about high-frequency variability of the sediment concentration under the influence of wind waves is necessary for the numerical modeling development of the vertical distribution of suspended sediment concentration and for reliable forecast of the sediment fluxes in the coastal zone.
Recommendations on the optimal location of equipment for measurement of the suspended sediment concentration taking into account physical characteristics of the sediment suspension will be considered here.
II. Main characteristics of the sand sediment suspension in the coastal zone
Over the past 25 years, the researchers of the P.P. Shirshov Institute of Oceanology RAS and its Southern Branch carried out a detailed field study of the sediment dynamics on specially equipped sites in the Black, Mediterranean and North seas [8, 9, 10] and laboratory experiments in the big wave channel of the Hannover University in Germany [11, 12, 13]. The main goal of these experiments was the creation of scientific knowledge about the processes of suspension and distribution of sand sediments in the different dynamic situations that occur in the coastal zone under storm impact.
The following devices were used in implementation of this research: optical turbidimeters for measurement of suspended sediment concentration (Fig. 1), 3-component acoustic gauge “Vector” for measurements of current velocity, 2-component electro-magnetic gauges of current velocity, acoustic backscatter sensors, video camera and photo apparatus [8, 13]. As a result the high-frequency synchronous data of the variability of the suspended sediment concentrations and hydrodynamic parameters in the coastal zone were obtained.
.jpg)
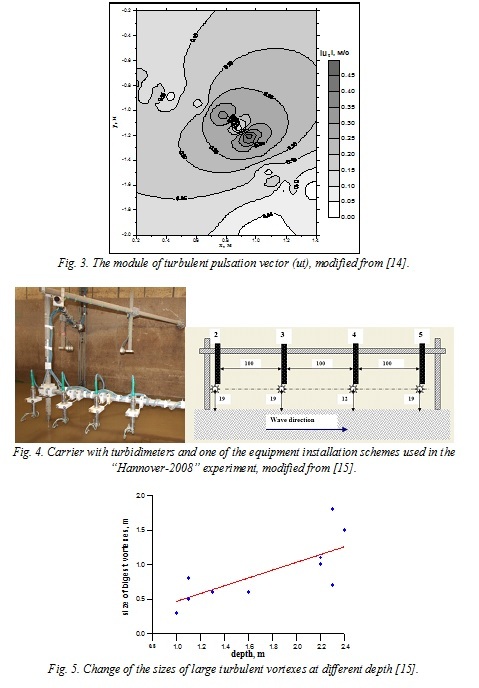
Field and laboratory observations show that kinetic energy of turbulent vortex structures is very important in the formation of suspended sediment concentration in the coastal zone. Previously, it was found [8] that the turbulent vortex structures move with the speed of the main water flow, because the module of turbulent component velocity is much less than the module of the velocity of vortex migration by the sensors. Figure 3 shows a diagram of the distribution module of the turbulent velocity fluctuations. The largest vortexes are located in the central part of the vortex structure moving in the wave flow. Turbulent vortex structures have a linear size of 1 to 5 m. The number of vortexes in group ranges from 3 to 7 pieces [14].
Within the framework of experiment "Hannover 2008" in the wave channel of the Hanover University I. Podymov, I. Darovskikh, A. Kochergin and O. Pushkarev conducted research of processes of suspended particles distribution in the horizontal plane [15]. Turbidimeters established consistently on a straight line in the direction of wave motion at the same distance from each other. Three series of tests were performed with the distance between turbidimeters 30, 50 and 100 cm (Fig. 4). The obtained data have allowed to estimate the sizes of the sand clouds taken by the generating turbulent vortexes. It is found that linear scale of individual vortexes is 0.2-2 m. A clear statistical correlation between the size of the turbulent vortexes and the average depth is not established yet, but the size of the largest vortexes occurs increases with the distance from the bottom (Fig. 5) [16]. The vortex diameter in the upper part usually is more than near bottom. Also it has been confirmed [8, 11] that under the deformed waves turbulent vortexes are formed in the same phase of separate waves, their characteristic size is tens of centimeters.
Seaward of the surf zone, in the unbroken weak deformed wave zone, turbulent vortex, formed behind the crests of the ripples are main mechanism of the sand sediment suspension from the bottom [17]. The suspension moments is confined with the moments of change of the velocity sign in the wave flow during deceleration or acceleration phases. With wave deformation increasing the sediment suspension take places only in the wave flow deceleration phase after the passage of a wave crests. Sand emission takes place due to turbulent vortexes which are formed due to the hydrodynamical shear instability in the bottom boundary layer. The life time of suspended sediment clouds approximately coincides with the wave period. Usually, peaks of concentration are observed only within 10-12 cm from the bottom, i.e. clouds of suspended sediments under deformed waves can penetrate to the up layers until limited height (Fig. 6). Macro turbulent vortexes generated by breaking waves are the dominant mechanism for the suspension of the sand sediments in the surf zone [8, 17]. In condition the plunging wave breaking the macro turbulent vortexes with horizontal axis are dominated and in spilling condition vortexes with inclined vertical axis are generated [18].
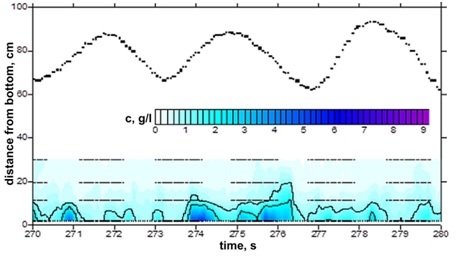
Fig. 6. Clouds of suspended sediments under deformed unbroken waves.
The form of vertical profiles of suspended sediment concentration changes very quickly with time and deviate significantly from the mean of suspended sediment concentration. When analyzing high-frequency fluctuations of vertical profile of suspended sediment concentration, we singled out several characteristic types of vertical distribution of concentration (Fig. 7) [11, 18].
As a general rule, a vertical profile close to logarithmic curve (Fig. 7a) is presented under small waves between groups of large waves, when water velocities are not large and diffusion processes prevail in the formation of suspended sediment field.
In the second case (Fig. 7b) high values of suspended sediment concentration are observed in the layer of 5 cm over the bed. They decrease sharply towards the surface. The concentration gradient is by ~1g/l per cm.
A third type of vertical distribution of concentration (Fig. 7c) is observed during the passage of large waves or during wave breaking. In this case the vertical profile is nearly linear. Sand, suspended from the bottom, can rise at the height of several tens of centimeters up. Maximum vertical gradients of concentration occur on 20-30 cm from the bottom [19].
Figure 7d shows a fourth type of vertical distribution of suspended sand. The vertical profile has the form of the broken line. Alternation of layers with high and low values of suspended sediment concentration is typical. Such a kind of vertical profile of concentration prevails after the passing of high waves when a cloud of suspended sand, separated from the bottom, is transported by the flow and gradually disperses and settles [19].
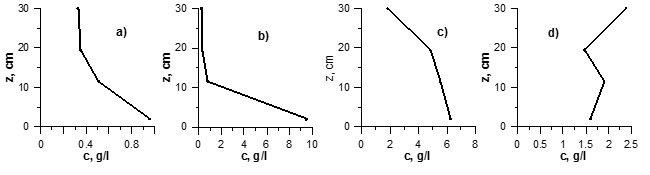
Fig. 7. Characteristic types of vertical distribution of suspended sediment concentration [19].
III. Variants of measurement points location
Taking into account the above-mentioned characteristics of the suspended sand concentration field the scheme of location of the turbidimeters (or other similar devices) can be optimized for the work in different hydrodynamic conditions in the coastal zone. In this case it is necessary to take into account the size of generating turbulent vortexes, the possible altitude of their penetration upwards, rotation axis orientation of the vortexes and other peculiarities. Further the possible variants of measurement point location are considered for a few typical hydrodynamic conditions. These considerations can be especially useful when researcher has not too many devices.
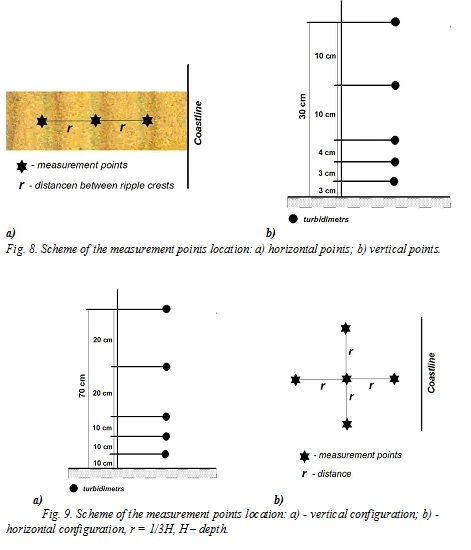
- For investigation of suspended sand concentrations in condition of the deformed waves and ripple bottom, the three measurement points which are located on the perpendicular to the water edge are more or less sufficient (Fig. 8a). The horizontal distance between measurement points is determined in accordance with the distance between ripple crests. As the vortexes are formed in these hydrodynamic conditions behind ripple crests and have almost vertical rotation axis, the turbidimeters are to locate necessary over ripple crests at the beginning of experiment and further to fix ripple shift rather initial situation by help of the video equipment (Fig. 8а). One of the possible schemes for vertical location of the turbidimeters is shown in figure 8b. The measurement points can be located on the crests of the neighboring ripple or with a step which multiple of the distance of the ripple lengths. Turbidimeters are placed at 20-30 cm from a bottom as under lightly deformed waves significant amount of suspended sand are marked in near bottom layer only. Location of turbidimeters with smaller vertical step is recommended for the horizons up to 10 cm from the bottom (Fig. 8b). It will allow to record features of the vertical concentration profile with the maximal gradient.
- In deformed and breaking by spilling waves condition, location of turbidimetrs with smaller vertical step is recommended for the horizons 10-30 cm from the bottom (Fig. 9а). The biggest vertical gradients of suspended sand concentration are noted at such distance [19]. Horizontal scheme of the turbidimeters location is shown in figure 9b. The distance between the measurement points location is approximately equal to 1/3 of the depth measurements. Such location scheme allows to take into account that there is a resize of the formed vortex groups at different depth [16] and to record the sand suspension clouds created and moving in water flow.
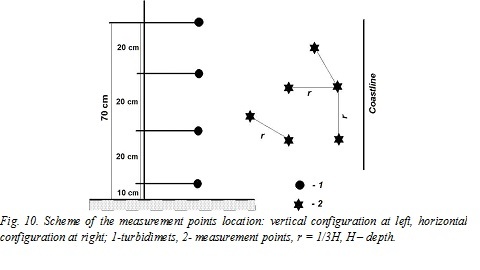
- Under plunging waves, the suspended sand concentration increasing takes place for the whole water depth and the maximum vertical gradients of concentration are observed at various distances from the bottom. Uniform vertical location of the turbidimeters (Fig. 10) is recommended for such case. As vortexes forming under plunging waves move with a wave flow and time of their life is more than a wave period, the simultaneous recording of horizontal gradients of the suspended sediment concentration is important. An example of the horizontal location of turbidimeters is presented in figure 10. The distance between measurement points has to be less than a typical vortex size. Such location of the turbidimeters allows to interpolate obtaining data and to make map of suspended sediment concentration distribution.
IV. Conclusion
The recommendations of the measuring equipment location, described in this paper, are based on the modern scientific data about features of sand suspension mechanisms in the coastal zone in storm conditions. They can be useful useful for ensuring correct and accurate collection and analysis of field data on the concentration of suspended sandy sediments for a small number of measurement points. The presented information is important to improve the quality of field collections.
V. Acknowledgments
The presented work is supported by the Russian Science Foundation (project no. 14-50-00095).
1. K. Black, C.E. Vincent, "High-resolution field measurements and numerical modeling of intra-wave sediment suspension on plane beds under shoaling waves", Coastal Engineering, 2002, V. 42, pp. 173-197.
2. R. Kos’yan, H. Kunz, S. Kuznetsov, N. Pykhov, "Suspended sediment transport in the surf zone of the Nordeney Island. Hydrodynamics, Theory and Applications", Proc. 2-nd Internal Conference on Hydrodynamics, Rotterdam, A.A.Balkema Publ. 1996, pp. 1119-1123.
3. R. Kos’yan, H. Kunz, S. Kuznetsov, N. Pykhov, M. Krylenko, "Sand suspension and intermittence of turbulence in the surf zone", Proc. of the 25 Int. Conference on Coastal Engineering, “Coastal Engineering”96”, American Society of Civil engineering, New York, 1997, pp. 4111-4119.
4. C.E Vincent., S.V. Marsh, M.P. Webb, P.D. Osborne, "Spatial and temporal structures of suspension and transport over mega-ripples on the shore face", J. Geophysical Research, 1999, V. 104, pp. 11215-11224.
5. L.C. Van Rijn, "Principles of sediment transport in rivers, estuarine and coastal seas", Aqua Publication, Netherlands, 1993, 860 p.
6. C. Villaret, G. Perrier, "Transport of fine sand by combined waves and currents: an experimental study", Electricite de France Report № HE-42/92.68, 1992, 81 p.
7. S. Kuznetsov, N. Pykhov, "Spectral test of energetic approach for suspended sand transport in the surf zone", Proc. of International Conference “Coastal Dynamics’97”, ASCE, 1997, pp. 227-234.
8. R. Kos’yan, H. Kunz, S. Kuznetsov, N. Pykhov, M. Krylenko, “The intermittency of turbulence in the surf zone and its influence on the sand suspension”, Oceanology, 1999, V. 39, № 2, pp. 298-305.
9. R. Kos’yan, D. Hanes, S. Kuznetsov, O. Mouraenko, I. Podymov, N. Pykhov, “Suspended sand concentration fluctuations under unbroken waves”, Proc. of the 5th Int. Conf. MEDCOAST, 2001, V.3, pp. 1235-1245.
10. R. Kos’yan, I. Podymov, N. Pykhov, P. Vorobyev, “Physical regularities of sand suspending under non-breaking, slightly shoaling waves”, Period biol, 2000, Vol. 102, supplement 1, pp. 121-128.
11. R.D. Kos’yan, B.V. Divinskiy, M.V. Krylenko, С.E. Vincent, “Modelling of the vertical distribution of suspended sediment concentration under waves with a group structure”, Proc. of the OCEANS’07 IEEE Aberdeen Conference and Exhibition Aberdeen Exhibition and Conference Centre, Aberdeen, Scotland, 2007.
12. R. Kos’yan, J. Grüne, B. Divinskiy, I. Podymov, C. Vincent, A. Ahmari, H. Oumeraci, “The dependence of suspended sand concentration on the degree of storm development”, Book of the 32nd International conference ICCE 2010. Shanghai, China, 2010.Shanghai, China, paper № 287.
13. R. Kos’yan, B. Divinskiy, J. Grüne, I. Podymov, C. Vincent, A. Ahmari, H. Oumeraci, “Laboratory research of the dependence of suspended sand concentration on the spectra form of irregular waves”, Proc. of the IX-th International Conference on the Mediterranean Coastal Environment, Sochi, Russia, 2009, (in Russian).
14. M.V. Krylenko, “Peculiarities of the small-scale turbulence in the coastal zone”, Proc. of the 3rd International workshop on Applied coastal research. Lecce, Italy, 2008, pp. 134-140.
15. M.V. Krylenko, "Research of mechanisms of formation of the concentration field of the suspended sand sediments in a coastal zone", Moscow, 2007, 126 p. (in Russian)
16. M. Krylenko, J. Grune, R. Kosyan, I. Podymov, “Features of suspension of sandy particles as a result of regular waves”, Proc. of the XXIV Internetional conference «Sea coasts - evolution, ecology, economy», Krasnodar, 2012, pp. 224-228. (in Russian)
17. R.D. Kos’yan, I.S. Podymov, N.V. Pykhov (Ed.), “Dynamical processes in the coastal zone”, Moscow, Nauchnyi Mir, 2003, 326 p.
18. P. Zhang, T. Sunamura, S. Tanaka, K. Yamamoto, “Laboratory experiment of longshore bars produced by breaker-induced vortex action”, Coastal Dynamics-94, ASCE, Barcelona, Spain, 1994, pp. 29-43.
19. R.D. Kos’yan, M.V. Krylenko, C.E. Vincent, “Fluctuations of instantaneous vertical distribution of suspended sediment in the surf zone”, Proc. of the 30th International Conference on Coastal Engineering (ICCE), 2007, pp. 2524-2536.