


BISAC NAT010000 Ecology
BISAC NAT045050 Ecosystems & Habitats / Coastal Regions & Shorelines
BISAC NAT025000 Ecosystems & Habitats / Oceans & Seas
BISAC NAT045030 Ecosystems & Habitats / Polar Regions
BISAC SCI081000 Earth Sciences / Hydrology
BISAC SCI092000 Global Warming & Climate Change
BISAC SCI020000 Life Sciences / Ecology
BISAC SCI039000 Life Sciences / Marine Biology
BISAC SOC053000 Regional Studies
BISAC TEC060000 Marine & Naval
The ability of a bay and gulf ecosystems to self-purification was estimated and the current ecological state of the Sevastopol Bay in whole and the separated parts of the bay was given as an example. A zoning by type of anthropogenic impact subject to the water exchange with the open sea and an influence of the Chernaya River run-off were taken into account. A comparative analysis of assimilation capacity of the most environmentally disadvantaged part of the Sevastopol Bay (the Southern Bay) and the clean water area, bordering on the open sea, was carried out. The hydrodynamic regime of the Sevastopol Bay was described using numerical modelling. The prospect, opportunity and examples of the methodology for assessing the assimilation capacity of marine ecosystems are demonstrated.
ecosystem, the Sevastopol Bay, inorganic nitrogen forms, assimilation capacity, hydrodynamic regime.
I. Introduction
The threat to environment safety of the shallow water areas with high anthropogenic impact and limited water exchange comes not only from the high concentration of pollutants but also the formation of spots of “chronic” pollution. Different pollutants have negative effect on the sea ecosystem state that causes the need to improve the situation.
The
Current ecological state of the
The aim of this paper is to compare the assimilation capacity of the most polluted
II. Materials and methods
This research is based on the long-term monitoring carried out by the Marine Hydrophysical Institute (MHI) in the


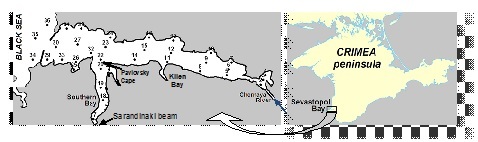
Fig.1. A network of stations for monitoring in the
The bay zoning were used as a scientific justification for the choice of the most and less polluted areas in the Sevastopol Bay by the anthropogenic impact [1] and by the peculiarities of morphological structure [2]. The bay is divided on four areas: of low, of moderate, of strong and of very strong pollution. Interesting fact is that the dedicated areas coincide with the bay zoning according the morphological parameters [2]: zone 1 is of low pollution; zone 5 (with the area of oil harbor) is of moderate pollution; zones 3 and 4 are of strong pollution; zone 2 (the Southern bay) is of high level of contamination.
To carry out the effective actions of improvement of ecological bay water state it is important to evaluate the dynamic in this area using modeling, to estimate quantitatively and to forecast the different external influences on the ecosystem. The main model component should be the hydrodynamic model which describes the circulation dynamic in the region.
The hydrodynamics in the bay was calculated using the unsteady 3D version of hydro-thermodynamic model
The assimilation capacity method was used to evaluate sea water self-purification. The assimilation capacity is ability the sea ecosystem to sustain the addition of some pollutants without the development of irreversible biological consequences [4]. The assimilation capacity has a dimension of a flow of matter, namely, a mass of matter in a volume unit per a time unit.
The problem of the assimilation capacity estimation has two aspects. The first one is that is difficult to determine the cause-and-effect relationships between the pollution and biological impact. The second one is connected with the difficulties of the forward and reverse transition from the unit of flow (how the assimilation capacity is measured) and the unit of mass how the environment pollution is measured.
To overcome difficulty of the first aspect the weakest link in ecosystem should be found. On that basis the threshold of vulnerability of the whole ecosystem is determined [5]. To overcome difficulty of the second aspect the balance method is used [4]. But it is not always possible to use this method because the observing over the sea pollution is not constant and the intervals between the observing are longer than the time of the inner environmental remediation of object under study.
This balance method was successfully used for the evaluation of assimilation capacity in the port of Odessa and the port of Nikolayev in relation to oil and phenol [6, 7], as well as in the Dnieper estuary ecosystem subject to zoning of water areas according to the anthropogenic loading [8].
In case of lack of long-term monitoring to evaluate the assimilation capacity of sea waters it is possible to use “synoptic” method [9]. Long and repeated observations are not needed for the application of this method. We need only data of one oceanographic survey. This method is based on the assumption of the survey results that the inhomogeneous distribution of pollutants in homogeneous water mass according to the physical parameter is the result of self-purification in water. The last storm is the reference point of this process (that is why this method called “synoptic”).
This method is based on the analyses of the inhomogeneous distribution of pollutants in hydrologically homogeneous water. The point T,S-charts were made according the results of each survey. The water mass is shown on these charts as a “cloud” of points. Each point means the water sample under chemical analysis (a data of temperature, water salinity in bottom and surface layers is needed for plotting these charts).
The assimilation capacity of the
The final formula for the evaluation of mean and mean square deviation of the assimilation capacity of sea ecosystem (m) against i-pollutant is following:
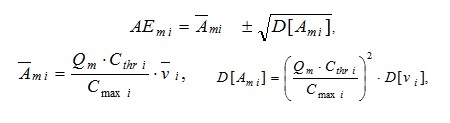
where Qm is a volume of water in the calculated domain; Cthr i is a threshold limit of pollutants; Cmax i is a maximum pollutant concentration in ecosystem; vi is a rate of pollutant elimination from the ecosystem; a mean value and a dispersion of the rate is defined by the original algorithm [10].
The data set about three forms of nitrogen was used for the evaluation of assimilation capacity of the Southern Bay. This data is obtained from 1998 to 2012. It composes 714 definitions for the Southern Bay and 1117 definitions for the zone 1.
III. Results and discussion
Modeling of hydrodynamics in the
It is insufficient to pay attention the bay water dynamics despite the fact that exactly the flows have an influence on the exchange with the open sea and determine the ecological situation in the water area. The different aspects of the bay water dynamics were fully researched using mathematical modeling [11]. In situ measurements of currents are less presented in literature [12].
Special dynamic conditions were in the zone 1 (sea depth is 19 m). The two-layer multidirectional flows are seen here. The western flows prevail in upper 10 m layer. These are the runoff flows caused by the
- The first case happens in spring and after continuous pouring rains (about 4 days). These increases runoff flows. In this case we see the western flows in the whole 19 m layer.
- One-layer flow is also in the second case. But it has another direction (into the bay). The observations were made in early summer after strong offshore winds (up to 14 or 16 m/s).
The modeling of pollutants spreading in the Southern bay is showed [14] that the pollutants will be accumulated in water by typical water volume of rain runoff and sewage at the north winds. This worsens water quality. The pollutants are carried by wind currents of other directions outside the Southern bay. The relatively fast purification of the Southern bay occurs on condition of sewage stopping.
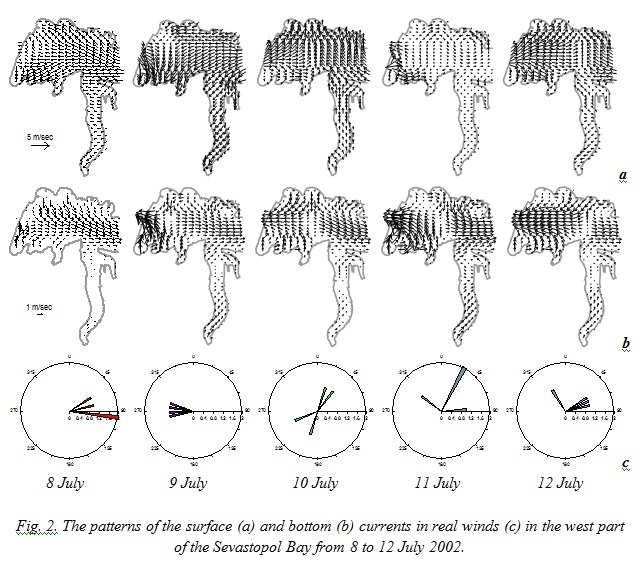
The patterns of current are shown on Fig.2 which was obtained using model
The patterns of surface current is given on Fig.2, a and of bottom current – on Fig.2, b from 8 to 12 July, when the wind direction was suddenly changed, even during the day. Fig.2, c shows the actual wind at 6-hours discreteness at 8 – 12 July.
The current changes cardinally after the wind direction changing. In zone 1 the water exchange is quite intensive due to close location with the open sea. Under certain wind conditions the flow current is 40 – 60 cm/sec in the input channel; and 15 – 20 cm/sec in the bottom layer. A 2 – 3-layer structure of flow of different directions is observed in the strait.
The Southern Bay is comparative shallow water area; therefore currents are determined mainly by wind. The south wind contributes the water exchange from the Southern bay to the
The assimilation capacity of the Southern bay ecosystem and the Bay ecosystem adjoin the open sea towards the inorganic nitrogen, based on long-term monitoring of ecological state.
The southern part of the
In the surface layer the water (especially in the inner part) is characterized by the maximum concentrations of nitrogen. At the same time on nitrates the 20-fold increase over the average values is seen in the
The self-purification capacity towards inorganic nitrogen (nitrites, nitrates and ammonia nitrogen) as a priority pollutant in municipal wastewater and storm water was evaluated for the Southern Bay and a part of the
The mean inorganic nitrogen for observing period did not exceed the corresponding maximum permissible concentration (MAC) which was used as threshold. The calculated specific (per 1 liter) values of the assimilation capacity for each form of inorganic nitrogen differ from the corresponding MAC (Table). This makes possible to estimate the limit of each ecosystem to self-purification capacity.
Comparative values of the assimilation capacity for the Southern Bay ecosystem and the water area adjoin the open sea (zone 1) for inorganic nitrogen are given in Table. For calculation of the assimilation capacity the morphometric parameters of areas under study were used from [2].
For the Southern Bay the maximum specific rate of pollutant elimination from the ecosystem reached 0.03 µM/l day for nitrites; 2.10 µM/l day for nitrates and 0.32 µM/l day for ammonium nitrogen that exceeds the average rate of elimination in 3 – 4 times. For zone 1 the maximum specific rates of elimination were 0.066 µM/l day for nitrites, 1.28 µM/l day for nitrates and 0.94 µM/l day for ammonium. For more clear water area the average rate of elimination were from 4.5 to 5.5.
Table. The assimilation capacity of the Southern Bay ecosystem and the ecosystem of the Sevastopol Bays adjoin the open sea (zone 1) for inorganic nitrogen.
|
Parameter, units |
NO2 |
NO3 |
NH4 |
|||||
|
Southern Bay |
zone 1 |
Southern Bay |
zone 1 |
Southern Bay |
zone 1 |
|||
|
Number of measurements |
240 |
373 |
225 |
351 |
249 |
393 |
||
|
Threshold value of concentration, µM/l |
1,43 |
221,43 |
20,71 |
|||||
|
Average concentration, µM/l |
0,23 |
0,12 |
12,59 |
2,45 |
0,95 |
0,57 |
||
|
Max concentration, µM/l |
1,48 |
0,42 |
142,79 |
13,31 |
8,17 |
8,18 |
||
|
Average rate of elimination, µM/l day |
0,008 |
0,012 |
0,49 |
0,28 |
0,10 |
0,21 |
||
|
Specific assimilation capacity, µM/l year |
1,77 |
15,57 |
212 |
1863 |
48 |
197 |
||
|
Volume of Southern Bay, m3 |
10253990 |
|||||||
|
Volume of zone 1, m3 |
33825650 |
|||||||
|
Assimilation capacity, t/year |
0,25 |
7,4 |
30 |
880 |
7 |
93 |
||
The Southern Bay is characterized by high values of maximum concentrations with respect to zone 1 (Table). The nitrates and nitrites concentration exceeds in 10 times and 3 times, respectively and the ammonium concentration is in the same range for these two zones.
According to the above mentioned estimations of the Southern Bay ecosystem capacity to the self-purification amount of inorganic nitrogen must not exceed 0.25 ton for nitrites, 30 ton for nitrates and 7 ton for ammonium nitrogen. Note, the quantitative limit of inorganic nitrogen conforms uniform discharge of pollution. In case of the emergency discharge to estimate the ecosystem self-purification capacity, we should consider the specific value of assimilation capacity for nitrites, nitrates, ammonium 0.0048, 0.58, 0.13 µM/l day respectively. Because we do not have exact information about total volume of inorganic nitrogen which get in the Southern Bay by municipal and storm water than it is impossible to estimate how many times this level is exceeded now. In zone 1, the threshold value is 7.4 ton for nitrites, 880 ton for nitrates and 93 ton for ammonium nitrogen. Note, differences take place with respect to overestimation of average rate of elimination which were lower in the Southern Bay (3,5 – 4 times) than in zone 1 (4,5 – 5,5 times). Probably this is connected with the dominance of biological processes in clear zones (recirculation of inorganic nitrogen) over anthropogenic impacts. However, the problem demands additional study.
IV. Conclusions
The
The possibilities of the previously developed method for the assimilation capacity calculation to normalize of pollutant discharges were estimated for marine ecosystem. Firstly the comparative estimations of the assimilation capacity in the Southern Bay as the most polluted part of the
We showed that the self-purification capacity of the Southern Bay ecosystem depends mainly on the anthropogenic impact level while for the ecosystem adjoin the open sea (zone 1) this capacity depends on both anthropogenic impact and biological productively-destructive processes which are connected with recirculation of inorganic nitrogen.
Considering the mentioned quantitative limits in which all the recycling processes considered a standardization of discharges will make a contribution to the improvement of ecological situation both in the Southern Bay and area adjoin open sea. As a result it decreases the load on the
1. V.A.Ivanov, E.I.Ovsianyi, L.N.Repetin, A.S.Romanov, and O.G.Ignateva, Hydrological-hydrochemical impact of Sevastopol Bay and its changes caused by climate and anthropogenic influences, 2006, 90 p. (in Russian)
2. N.A.Stokozov, “The morphometric characteristics of Sevastopol and Balaklavskaya bays,” Ecological safety of coastal and shelf zones and complex usage of shelf resources, vol. 23, pp.198-208, 2010. (in Russian)
3. V.A.Ivanov, and Yu.S.Tuchkovenko, Applied mathematical water-quality modeling of shelf marine ecosystems, 2008, 311 p.
4. I.A.Israel, and A.V.Tsyban, The anthropogenic ecology of ocean, Hydrometeoizdat, 1989, 528 p. (in Russian)
5. S.K.Monakhov, A.A.Kurapov, and N.V.Popova, “The estimation of assimilation capacity of a water area and ecological regulation of pollutant discharge at the sea”, Vestnik DSC RAS, vol.20, pp.58-65, 2005. (in Russian)
6. I.V.Mezentseva, E.E.Sovga, and S.P.Lyubartseva, “Estimation of capability of Odessa port ecosystem for self-purification capacity in relation to oil products and phenols,” Ecological safety of coastal and shelf zones and complex usage of shelf resources, vol.22. pp. 303-309, 2010. (in Russian)
7. I.V.Mezentseva, “Complex characteristic of water quality of Nikolaev marine commercial port at 2008 - 2012,” Ecological safety of coastal and shelf zones and complex usage of shelf resources, vol.28, pp.220-224, 2014. (in Russian)
8. E.E.Sovga, I.V. Mezentseva, and S.P. Liubartceva, “Assimilation capacity of the Dnieper estuary ecosystem in relation to oil products as method of discharge regulation in the estuary,” Report of NAS of Ukraine, vol.10, pp.105-109, 2011. (in Russian)
9. G.A.Monakhova, G.M.Abdurakhmanov, and G.A.Akhmedova, et al. “Estimation of assimilation capacity of licensed water area “North-Caspian area” in relation to hydrocarbons using “synoptical” method,” Geography and geoecology of the south of Russia, vol.4. pp. 207-212, 2011. (in Russian)
10. E.Sovga, I.Mezentseva, L.Verzhevskaia, Assimilation Capacity of the Ecosystem of Sevastopol Bay // Proceedings of the Twelfth International Conference on the Mediterranean Coastal Environment MEDCOAST' 2015, 6-10 October 2015. Varna, Bulgaria, 2015. (Ed. E.Ozhan). vol. 1. pp.317-326.
11. N.B.Shapiro, and S.A.Yushchenko, “Modelling of wind currents in Sevastopol Bays,” Marine Hydrophysical Journal, vol. 1, pp.42-56, 1999. (in Russian)
12. E.M.Lemeshko, A.N.Morozov, S.A.Shutov, V.V.Zima, and A.A.Chepyzhenko, “Currents in Sevastopol Bay according to ADCP-data, November 2014,” Ecological safety of coastal and shelf zones and complex usage of shelf resources, vol. 28, pp. 25-30, 2014. (in Russian)
13. M.S.Nemirovsky, and I.Y.Eremin, “Water dynamics of the Sevastopol roads,” Ecological safety of coastal and shelf zones and complex usage of shelf resources, vol. 9, pp. 59-66, 2003. (in Russian)
14. V.A.Ivanov, I.V.Mezentseva, E.E.Sovga, K.A.Slepchuk, and T.V.Khmara, “Estimations of self-purification capacity of the Sevastopol Bay ecosystem in relation to inorganic nitrogen,” Processes in GeoMedia, v.2. pp. 55-65, 2015. (in Russian)