


BISAC NAT010000 Ecology
BISAC NAT045050 Ecosystems & Habitats / Coastal Regions & Shorelines
BISAC NAT025000 Ecosystems & Habitats / Oceans & Seas
BISAC NAT045030 Ecosystems & Habitats / Polar Regions
BISAC SCI081000 Earth Sciences / Hydrology
BISAC SCI092000 Global Warming & Climate Change
BISAC SCI020000 Life Sciences / Ecology
BISAC SCI039000 Life Sciences / Marine Biology
BISAC SOC053000 Regional Studies
BISAC TEC060000 Marine & Naval
“Wind-shadowing” effects in the Gulf of Finland coastal zone are analyzed using high resolution Envisat Synthetic Aperture Radar (SAR) measurements and model simulations. These effects are related to the internal boundary layer (IBL) development due to abrupt change the surface roughness at the sea-land boundary. Inside the "shadow" areas the airflow accelerates and the surface wind stress increases with the fetch. Such features can be revealed in SAR images as dark areas adjacent to the coastal line. Quantitative description of these effects is important for offshore wind energy resource assessment. It is found that the surface wind stress scaled by its equilibrium value (far from the coast) is universal functions of the dimensionless fetch Xf/G. Wind stress reaches an equilibrium value at the distance Xf/G of about 0.4.
wind transformation in coastal area, internal boundary layer, SAR, wind energy, Gulf of Finland
effects of wind shadowing and IBL development with fetch. Wind above the IBL corresponds to the characteristics of the airflow above the land and, therefore, has a lower energy potential.
The main goal of this study is investigation of coastal area wind field features, associated with effect of wind acceleration in the developing IBL. The research is based on the measurements from synthetic aperture radar (SAR) ASAR (Advanced SAR) onboard Envisat satellite.
II. Study area and data
SAR measurements are the “ideal” tool for studies of wind field in the coastal area. The main advantages of SAR data are high spatial resolution (about 10 meters) and independence on presence of clouds. Examples of wind field studies using SAR measurements can be found in [6,7].
In total 10 SAR images of the Gulf of Finland was selected for this study. Each of the images represents typical scenario of the IBL development in the “homogeneous” incoming flow of different speed and atmospheric stratification.
For the analysis and interpretation of SAR measurements, the following data characterizing background conditions were used. Global Odyssea Sea Surface Temperature Analysis (http://satin.rshu.ru/) data were used for the sea surface temperature assessment. Land surface roughness lengths were defined from Global Land Use 2000 with a spatial resolution of 250 meters (http://bioval.jrc.ec.europa.eu/products/glc2000/products.php). The vertical temperature profile data from NCEP reanalysis (http://rda.ucar.edu/datasets/ds083.2/) were used as information about background atmosphere stratification. The land surface temperature was also taken from NCEP reanalysis. Table 1 summarizes the background parameters for the considered cases of PBL transformation in the Gulf of Finland coastal zone.
Table 1. Observation data: U1000 is wind at 1000 meters, 𝜃1000 is potential temperature at 1000 meters, 𝜃S is water surface potential temperature, 𝜃L is land surface potential temperature, z0 is roughness length.
|
№ |
U1000, м/с |
𝜃1000, °C |
𝜃S, °C |
𝜃L, °C |
z0, м |
|
1 |
32 |
3 |
3.4 |
-2 |
0.8 |
|
2 |
27 |
3 |
3.4 |
-2 |
0.8 |
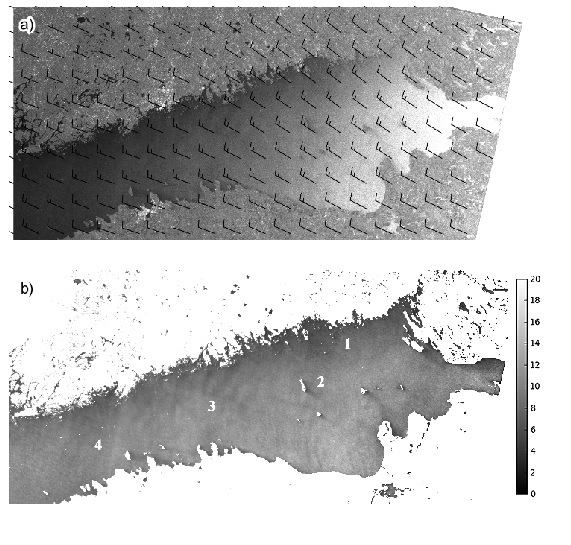
Fig. 1. (а) Fragment of ASAR Envisat image at 08.11.2011 08:51 UTC for eastern part of the Gulf of Finland: arrows indicate wind speed and direction from NCEP GFS model; (b) Wind field reconstructed from SAR data. Numbers in image indicate: 1 is shading area, 2 is island wakes, 3 is fingerprint of atmospheric internal gravity waves, 4 is cluster of ships.
The northern coast of the Gulf of Finland is a skerry-type with many rocky islands of various sizes and the straits between them that complicates analyze of the IBL development at the northern direction of the wind. Therefore, further we consider only cases of the southern winds.
III. Results
Fig. 2 shows a fragment of wind field derived from ASAR on the 2 January 2012, using NCEP wind directions, Fig. 3(a). According to the NCEP GFS data wind direction over the Gulf of Finland was mostly southeast. Long wind shadows of the islands and wind shadow along the southern coast are clearly seen on this image. Note that the width of the shadow along the normal to coastline depends on wind direction relative to the shore. It is clearly seen that the width is maximal where wind blows perpendicular to the coastline and minimal where wind blows along coastline. These features indicate that the development of IBL can be described by the one-dimensional model.
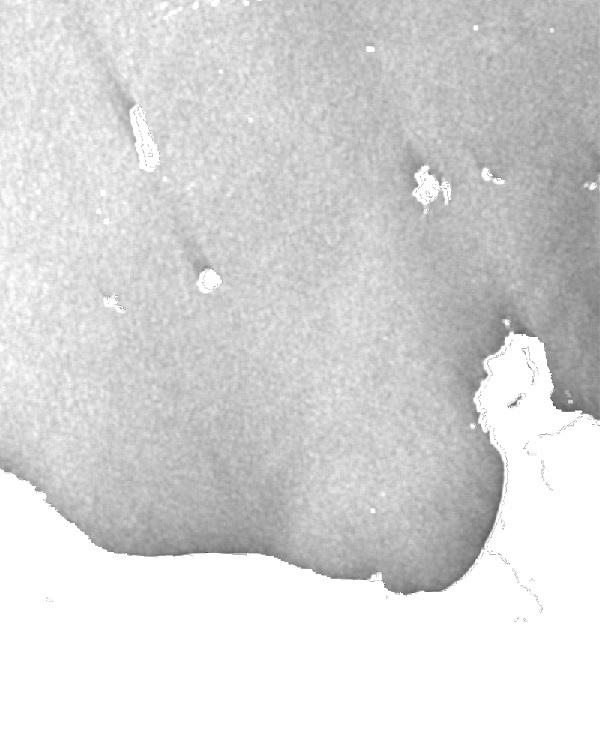
Fig. 2. Wind field reconstructed from ASAR Envisat image at 02.01.2012 08:33 UTC;
Measured profiles were simulated using a simplified model of atmospheric boundary layer transformation over inhomogeneous surface [5]. The input parameters of the model are the temperature and wind speed at certain level in the background PBL, the surface temperature of the land and water and surface roughness parameter. The output of the model gives change of the boundary layer parameters including changes of the surface wind stress and IBL height with fetch.
The input parameters of the model listed in Table 1. In this case stably stratified airflow enters the warm sea surface leading to the rapid development of unstable IBL.
Model simulations were performed for transections AB and CD along the wind direction (Fig. 3b). Profiles of the surface wind stress along these transects are shown in Fig. 3b and Fig. 3c.
.bmp)
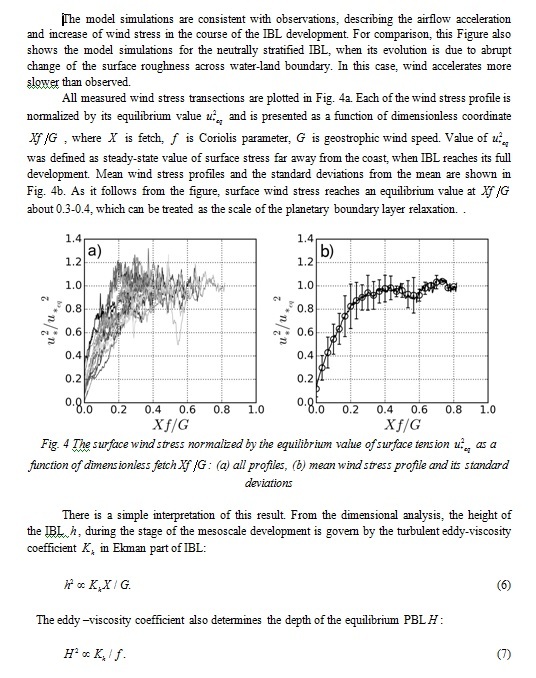
Fig. 5 shows an example of model wind profile and wind power density for the case of multitransformation of the PBL caused by the transition from land to water surface and from water to land surface. The initial conditions for the model was: wind speed at 10 m is 5 m/s, neutral stratification; land surface roughness length is 0.8 m. Figure shows that the maximum of wind energy potential is achieved on the windward coast of the Gulf. And at the height of 50 meters (commercial wind turbines height varies from 40 to 170 meters) the maximum of wind power density is maintained above the land surface for about one kilometer from the coastline.
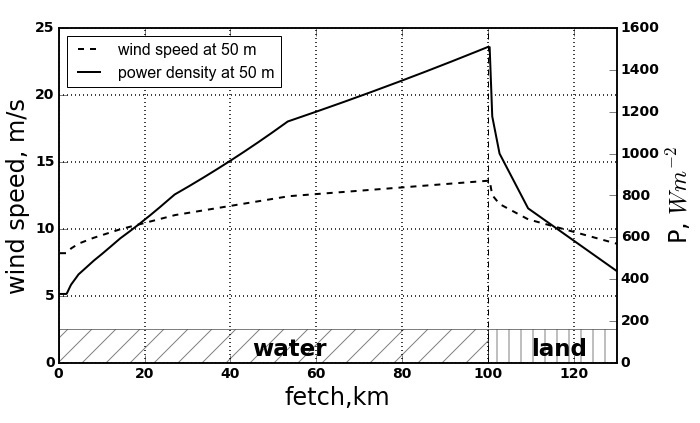
Fig. 5 Wind profile (dashed line) and wind power density profile (solid line) at height of 50 meters calculated with IBL model [5].
IV. Conclusions
Wind field features in the coastal zone of the Gulf of Finland were analyzed with use of high-resolution SAR measurements. In particular, the effect of “wind shading” as air flows from land to water surface was investigated. Such shading effects are caused by the fact, that atmospheric boundary layer initially adapted to the “rough” land surface, moves to “slippery” water surface, where it accelerates and surface wind stress increases with fetch. In SAR images areas of acceleration are seen as “dark” areas – areas of shading. Such features were observed in all analyzed here SAR images, either as shading areas along the coastline, or as wind “shadows” behind leeward side of the islands. Width of the "shadow" depends on the wind speed and atmospheric boundary layer stratification. Measurements showed that in the area of wind acceleration the surface stress, normalized to the equilibrium value (far from the coast) is universal functions of the dimensionless fetch. Surface wind stress reaches an equilibrium value at , which is the scale of the planetary boundary layer relaxation under the sea surface.
V. Acknowledgment
This work was supported by the state assignment (№ 5.2483.2014/К and № 5.2498.2014) and Russian Foundation for Basic Research Funding (№ НК 14-05-91760/14). ASAR data were obtained within the project ESA CAT-1 proposal (C1F-4483).
1. J.R. Garrat, “The Internal Boundary Layer - A review,” Boundary-Layer Meteorol, vol. 50. pp. 171-203,1990.
2. E.F. Bradley, “A micrometeorological study of velocity profiles and surface drag in the region modified by a change in surface roughness,” Quart. J. Roy. Meteorol. Soc, vol.94, pp. 361-379, 1968.
3. G.S. Raynor, P. Michael, R.M. Brown, S. Sethurman, “Studies of atmospheric diffusion from nearshore oceanic site ,” J. Appl. Meteorol, vol. 7, pp. 331-348, 1975.
4. G.S. Raynor, S. Sethurman, R.M. Brown, “Formation and characteristics of coastal internal boundary layers during onshore flows.” Boundary-Layer Meteorol, vol. 16, pp. 487-514, 1979.
5. V.N. Kudryavtsev, V.K. Makin, A.M.G. Klein Tank, J.W. Verkaik, “A model of wind transformation over water-land surfaces.” Scientific report, De Bilt, vol. l, pp. 30, 2001.
6. R. C. Beal, G. S. Young, F. Monaldo, D. R. Thompson, N. S. Winstead, C.A. Scott, High resolution wind monitoring with Wide Swath SAR: A user's guide, Washington, DC: U.S., Department of Commerce, 2005, 155p.
7. W. Alpers, A. Mouche, A. Y. Ivanov, B. Brümmer, “High resolution wind fields over the Black Sea derived from Envisat ASAR data using an advanced wind retrieval algorithm,” The Pan Ocean Remote Sensing Conference (PORSEC), Kochi, Kerala, India, 2012.
8. H. Hersbach, “CMOD5.N: A Cband geophysical model function for equivalent neutral wind,” ECMWF Technical Memorandum, vol. 554, 22 p, 2008.
9. H. Charnock, “Wind stress on water surface,” Quart. J. Roy. Meteor. Soc., vol. 81, pp. 639-640, 1955.
10. N. Wiener, “Extrapolation, Interpretation, and Smoothing of Stationary Time Series with Engineering Application”, M.I.T. Press and John Wiley and Son, 1949.
11. R.A. Brown., “On two-layer models and the similarity functions for the PBL,” Boundary-Layer Meteorology, vol. 24, № 4, pp.451-463, 1982.
12. S.S. Zilitinkevich, “Velocity profiles, resistance law and the dissipation rate of mean flow kinetic energy in a neutrally and stable stratified Planetary Boundary Layer,” Boundary-Layer Meteorol, vol. 46, pp. 367-387, 1989.