


BISAC NAT010000 Ecology
BISAC NAT045050 Ecosystems & Habitats / Coastal Regions & Shorelines
BISAC NAT025000 Ecosystems & Habitats / Oceans & Seas
BISAC NAT045030 Ecosystems & Habitats / Polar Regions
BISAC SCI081000 Earth Sciences / Hydrology
BISAC SCI092000 Global Warming & Climate Change
BISAC SCI020000 Life Sciences / Ecology
BISAC SCI039000 Life Sciences / Marine Biology
BISAC SOC053000 Regional Studies
BISAC TEC060000 Marine & Naval
The catchment area of the Pregolya River is about 65% of the Vistula Lagoon drainage basin and occupied by Russia and Poland in approximately equal proportions. Nutrient load from the catchment largely controls the eutrophication processes of the lagoon ecosystem. Open statistical data (2011-2014) were used for evaluating the nutrient loads. At present, the nutrient load from the major anthropogenic sources (population, livestock, poultry and crop production) is 53,267 tons N/year and 16,424 tons P/year in the Pregolya River catchment. This results in loads of 23,032 tons N/year and 2,819 tons P/year when the removal of nutrients by the harvest is taken into account. It was found that the load from anthropogenic sources in the Polish part of the catchment higher than in the Russian part by a factor of three times for nitrogen and two times for phosphorus. The reason for this is that Polish territory is relatively more agriculturally developed. In the Kaliningrad Oblast agriculture declined in the 1990-2000's and now about 50% of arable lands are not used, which creates a potential for development. Currently there is a positive trend of the agriculture development and the "Strategy of socio-economic development of the Kaliningrad Oblast until 2020" is expected to increase arable land by 70%, the number of cattle and pigs by factors of 3.5 and 9.5, respectively. This creates a potential for significant increases of the nutrients loading and eutrophication of the Vistula Lagoon. The nutrient load from the anthropogenic sources in the Russian part of the catchment can be compensated greatly by using the manure as organic fertilizer replacing mineral fertiliser, as at present time 40% of available arable land in the Kaliningrad Oblast is sufficient for utilization of all manure originated locally at the maximum fertilization rate recommended by HELCOM. At the same time more than 80% of the wastewater in Kaliningrad Oblast is not sufficiently treated. This poses a great potential for nutrient load reduction. The calculations showed that equipment of Kaliningrad city with the modern treatment facilities will reduce the nutrient load by 1,400 tons N/year and 290 tons P/year.
nutrient load, phosphorus, nitrogen, Pregolya River catchment area, Vistula Lagoon
I. Introduction
The Pregolya (Fig. 1) is the largest river that flows into the Vistula Lagoon of the
The aim of the study is to assess the nutrient load (nitrogen and phosphorus) in the Pregolya River Catchment from the major anthropogenic sources: population, livestock and poultry, crop production. It also takes into account the removing of nutrients by the harvest. The study does not include an assessment of nutrients input from the natural landscapes, atmospheric deposition and retention in the catchment and river network.
The actual nutrient load from the anthropogenic sources was assessed from 2014 data. In addition, the potential changes were analysed for two scenarios of human activity evolution (the preservation of trends and planned development).
The transboundary catchment position of the
II. Materials and methods.
The same methods of calculation of nutrient load for different national parts of the catchment were used in the study.
The anthropogenic sources of nutrient load in the catchment area were identified. The data were obtained from archives and electronic databases of the Territorial Authority of the Federal State Statistics Service in the Kaliningrad Oblast and Statistical Office in
To calculate the emissions of nutrients from the population a complete list of all localities and their inhabitants number was produced (the data are geographically referenced). The gross emissions [5] of
In the calculations of nutrients input from livestock, the annual load of nitrogen and phosphorus were determined according to the daily manure production per animal, content of nutrients in manure, the number of livestock and poultry in the farms and enterprises and households. The following manure daily production per animal were used in the estimations: cattle -
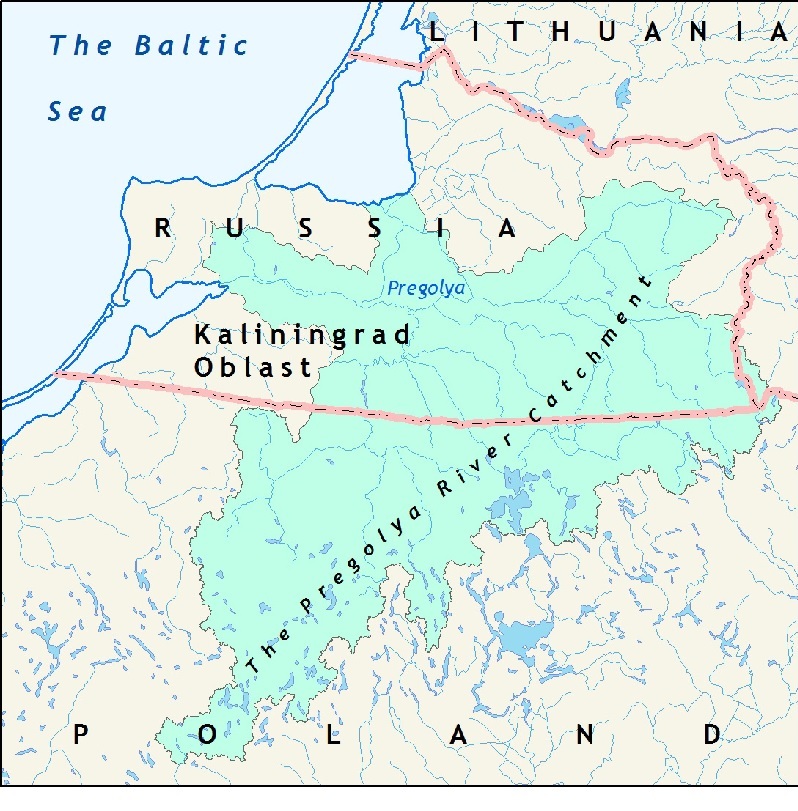
Fig. 1. The study area - transboundary catchment of the
An evaluation of the area actually used for arable land was carried out using the open access data for administrative districts [7]. With the existing map for zoning of the Kaliningrad Oblast [8] according to administrative district occupied by the sub-catchment area, the areas of arable land were calculated for these sub-catchment areas. The agricultural crop yield was estimated by statistical data [7, 9]. The following removal ratios were used for the main cultivated plants: crops – 3.3 kg/ha, potato – 0.15 kg/ha [6], rape and oilseeds – 1.6 kg/ha [10]. Most of the soils in the catchment are sod-podzolic.
III. Results and discussion
The basin is located in an agriculturally developed area, especially the Polish part. The Russian part of the catchment is mainly rural area too. Large industry facilities, such as
Thus, population, livestock including poultry breeding and crop production are the main anthropogenic sources of nutrients in the
Population
There are 660,000 inhabitants in the Russian part and 330,000 inhabitants in the Polish part of the
In the Russian part of the catchment 90% of urban population and 30% of inhabitants in the rural areas are connected to the sewerage network [11], while the corresponding numbers in the Polish part are 97% and 43%, respectively [12]. Three cities in the Russian part of the catchment have biological treatment systems: Guryevsk (50% of discharges), Krasnoznamensk (80%), Gusev (100%) [11]. In the Polish part nearly all wastewaters (98%) are treated [12]. For all treatment facilities, except
The load of total nitrogen and total phosphorus from point sources (the part of population connected to sewerage system) and urban areas (population without the sewerage system) are presented in Table 1.
Livestock and poultry farming
The livestock (cattle, pigs, goats and sheep) and poultry number was estimated from statistical data for administrative districts [15, 16]. A geographically referenced list of livestock and poultry enterprises and farms was compiled for Russian part. Livestock in households was calculated according to the rural population number [17]. The number of cattle in the Polish part is almost 3 times larger than in the Russian part of the catchment (143,000 and 52,000, respectively). The number of pigs in the Polish part is almost 1.3 times larger than in the Russian part (165,000 and 128,000, respectively) [15, 16]. According to data of 2014, the largest number of cattle and pigs in the Russian part were in the agricultural enterprises, while previously (2011), the number of cattle in households was almost equivalent to the number in agricultural enterprises, 45% and 51%, respectively. The number of poultry in the Russian part is almost 2 times more than in the Polish part of the catchment area (1,990,000 and 1,060,000 respectively). Most of the poultry in the Russian part is chicken, while half of the number in the Polish part is turkey.
The loads of total nitrogen and total phosphorus from livestock and poultry in the
Crop production
It was difficult to evaluate the area of the arable lands in Russian part of the catchment. Available cartographic materials and spatial planning schemes contain the information only on lands nominally attributed as arable. In reality, less than 50% of the available arable land is used in the Kaliningrad Oblast. To assess the area actually used as arable the open access data for administrative districts was used [7]. The area of arable land in the Russian part is about half of the area in the Polish part. The use of mineral fertilizers in agricultural land is on average 65.2 kgN/ha and 14.6 kgP/ha for the Warmińsko-Mazurskie Voivodship [16] and 18 kgN/ha and 2.7 kgP/ha for the Kaliningrad Oblast [18]. The load of nutrients from mineral fertilizers in the
For the nutrient balance the nutrient removal by the harvest is important as well as the load from anthropogenic sources (Table 1).
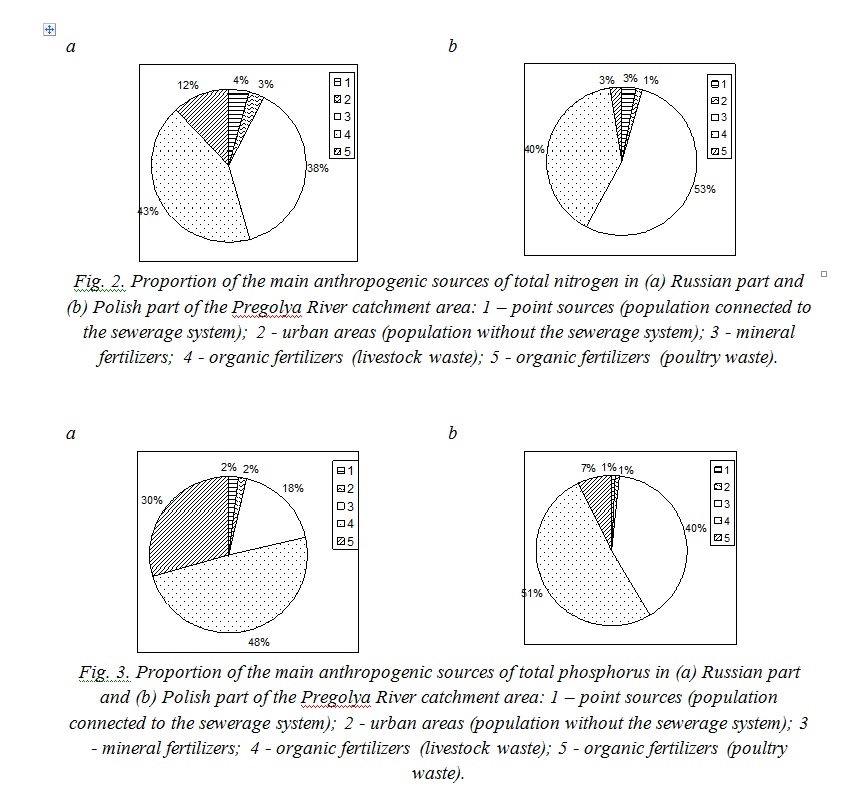
Chemical fertilizers and livestock waste are the most significant sources of nutrients. Poultry breeding is important for phosphorus emission in the Russian part of the catchment area. (Fig. 2, 3).
The nutrient load from the anthropogenic sources can be compensated greatly by using the manure as organic fertilizer replacing mineral fertiliser. In this respect, HELCOM recommends an upper limit of manure at
Table 1. The main components of anthropogenic nutrient load in the
|
Component of the anthropogenic load |
Total Nitrogen |
Total phosphorus |
||
|
RU |
PL |
RU |
PL |
|
|
tons/year |
tons/year |
tons/year |
tons/year |
|
|
Point sources (population connected to the sewerage system)* Total catchment area |
640 |
1,160 |
100 |
110 |
|
1,800 |
210 |
|||
|
Urban areas (population without sewerage system) Total catchment area |
540 |
500 |
90 |
75 |
|
1040 |
165 |
|||
|
Mineral fertilizers
Total catchment area |
6,000 |
20,000 |
900 |
4,500 |
|
26,000 |
5400 |
|||
|
Organic fertilizers (livestock waste)
Total catchment area |
6,698 |
14,882 |
2,508 |
5,827 |
|
21,580 |
8,335 |
|||
|
Organic fertilizers (poultry waste)
Total catchment area |
1,859 |
988 |
1,510 |
803 |
|
2,847 |
2,313 |
|||
|
Total nutrient load from the main anthropogenic sources
Total catchment area |
15,737 |
37,530 |
5,109 |
11,315 |
|
53,267 |
16,424 |
|||
|
Removal of nutrients by harvest
Total catchment area |
8,920 |
21,315 |
4,020 |
9,585 |
|
30,235 |
13,605 |
|||
|
Total nutrient load from the main anthropogenic sources after considering removal by harvest Total catchment area |
6,817 |
16,215 |
1,089 |
1,730 |
|
23,032 |
2,819 |
|||
Notes: * -
Potential changes of the nutrient load due to different scenarios of human developments in the
Two scenarios were formulated to assess possible changes of anthropogenic load as a result of alternative assumptions on human activities in the
Business as usual (BAU) - the scenario assumes preservation of the observed trend of development of agriculture and population. The last five years trends where analyzed for Russian and Polish parts of the
Documented future, official projections (DF). Further socio-economic development of Warmian-Masurian Voivodeship and environmental measures significantly depends on the implementation of the European Union program "Operational Program Eastern Poland 2014-2020". A significant increase in agricultural production is not expected [19, 20]. Analysis of the "Strategy of socio-economic development of the Kaliningrad Oblast in the long term" showed an expected increase in the area of arable lands by 70%, as well as cattle livestock and pigs by factors of 3.5 and 9.5, respectively (Table 2) [21]. As for population – a significant effect of the “Program of the Kaliningrad Oblast to assist the voluntary resettlement to the
Table 2. Quantitative assessment of agricultural developments for two different scenarios in the
|
|
Business as usual (BAU) |
Documented future (DF) |
||
|
Russian part |
Polish part |
Russian part |
Polish part |
|
|
Arable |
+5% |
0% |
+70% |
+3% |
|
Livestock |
|
|
|
|
|
Pigs |
+15% |
0% |
+950% |
+5% |
|
Cattle |
+15% |
0% |
+350% |
+5% |
|
Population |
+25% |
-6% |
+70% |
+3% |
In the case of implementation of BAU scenario (development in accordance with the existing trends), the total load from anthropogenic sources will increase by 1,423 tons N/year and 438 tons P/year, i.e. less than 3% (Table 3). In the case of implementation of the plans of Kaliningrad Regional Government in accordance with the “Strategy of Economic Development of the Kaliningrad Oblast until 2020“ (DF scenario) the significant rise of nutrient load by36,437 tons N/year and 12,317 tons P/year is expected, i.e. the total load from anthropogenic sources will double (removing by the harvest is not considered).
Table 3. Changes of the main components of the anthropogenic nutrient load in the
|
Component of the anthropogenic load |
BAU |
DF |
||
|
N total |
P total |
N total |
P total |
|
|
tons/ year |
tons/ year |
tons/ year |
tons/ year |
|
|
Point sources (population connected to the sewerage system) |
+90 |
+18 |
+483 |
+73 |
|
Urban areas (population without the sewerage system) |
+105 |
+18 |
+393 |
+65 |
|
Mineral fertilizers |
+300 |
+45 |
+4,800 |
+765 |
|
Organic fertilizers (livestock waste) |
+927 |
+357 |
+30,761 |
+11,414 |
|
Organic fertilizers (poultry waste) |
0 |
0 |
0 |
0 |
|
Total nutrient load from the main anthropogenic source |
+1,423 |
+438 |
+36,437 |
+12,317 |
|
Removing of nutrients by harvest * |
+446 |
+201 |
+6,883 |
+3,102 |
|
Total nutrient load from all anthropogenic sources with considering removing by the harvest t |
+977 |
+237 |
+29,554 |
+9,215 |
Note: * an increase in the runoff with the harvest is calculated in accordance with the increasing cultivation area, without taking into account changes in productivity.
A part of the increased load of nutrients will be removed by harvest (Table 3). Nutrient removal by harvest is calculated according to the extension of the arable lands and does not take into account the productivity increase. Hence the harvest removal is likely to be underestimated.
Kaliningrad wastewater
The wastewaters of
The construction of a sewage treatment plant for the city of
Introducing the modern treatment facilities in the
Table 4. Changes in nutrient load from
|
Nutrients |
Waste water treatment plants |
BAU |
DF |
|
Total nitrogen |
-1,400 |
+220 |
+1,390 |
|
Total phosphorus |
-290 |
+80 |
+500 |
IV. Conclusions
1. The nutrient load from the major anthropogenic sources (population, livestock, poultry and crop production) is 53,267 tons N/year and 16,424 tons P/year on the
2. The proportion of the anthropogenic nutrient load for the different national parts of the
3. Chemical fertilizers and livestock waste are the most significant sources of nutrients. Poultry breeding is important for phosphorus emission in the Russian part of the catchment area. Nutrient load from the population is noticeable only from the city of
4. Potential changes of the nutrient load were calculated for two future scenarios (BAU scenario – development in accordance with current trends; DF scenario – the official plans of the local authorities). For the BAU scenario the total anthropogenic load of nutrients will increase slightly – less than 3%. For the DF scenario, a significant rise of nutrient load is expected. Hence, the load from the anthropogenic sources will double (removing by the harvest is not considered).
5. The nutrient load from the anthropogenic sources in the Russian part of the catchment can be compensated greatly by using the manure as organic fertilizer replacing mineral fertiliser. At present time 40% of available arable land in Kaliningrad Oblast is sufficient for utilization of manure originated locally at the maximum fertilization rate recommended by HELCOM.
6. The calculations showed that equipment of
V. Acknowledgement
Data collection was made under support of the theme № 0149-2014-0017 of State Assignment of the P.P.Shirshov Institute of Oceanology of the
1. M.V. Silich, “Balance of the Lagoone”, Hydrometeorological regime of the Vistula Lagoon. Leningrad: Gidrometeoizdat, 1971, pp. 143-172.
2. S.V. Aleksandrov, J.A. Gorbunova, ”Nutrient load for the Vistula Lagoon from the Pegoliy River flow”, Water: chemistry and ecology, vol. 1, pp. 4-8, 2010.
3. S.I. Zotov, Modeling of geosystems. Kaliningrad: KSU, 2001.
4. BASE project 2012-2014, “Assessment and quantification of nutrient load to the Baltic Sea from Kaliningrad Oblast and transboundary rivers, and the evaluation of their sources”. HELCOM, 2014.
5. “What does domestic wastewater contain?”, Swedish Environmental Protection Agency Report 4425. Stockholm, 1995
6. The methodology of calculation of the removal of nutrients and evaluation of long-term state of pollution of small rivers, vol. 331. Belarus: Ministry of Natural Resources and Environmental Protection of the Republic of Belarus, September1999.
7. The arable lands and gross harvest of agricultural crops in the Kaliningrad region in 2014: Statistical Yearbook. Kaliningrad: Federal State Statistics Service, 2015.
8. D.A. Domnin, B.V. Chubarenko, Atlas of river basins of transboundary Kaliningrad Oblast. Kaliningrad: Tera Baltika, 2007.
9. “Kaliningrad Oblast and Warminsko-Mazurskie Voivodship in numbers 2014”, Statistical Yearbook by Territorial Authority of the Federal State Statistics Service in the Kaliningrad Oblast and Statistical Office in Olsztyn. Olsztyn: Statistical Office in Olsztyn, 2015.
10. A. Shcherbakov, The spring oil-bearing plants. Minsk: FUAinform, 1999.
11. “Sewerage in the Kaliningrad Oblast in 2014”, Statistical Yearbook. Kaliningrad: Federal State Statistics Service, 2014.
12. Statistical Yearbook of Warmińsko-Mazurskie Voivodship 2014. Olsztyn: Statistical Office in Olsztyn, 2015.
13. “Nutrient Loads to the Swedish Marine Environment in 2006”, Sweden's Report for HELCOM's Fifth Pollution Load Compilation. Stockholm: Naturvardsverket, 2009.
14. B. Liss, “Quantification of nitrogen and phosphorus load from local on-site wastewaters treatment”. Degree dissertation, Uppsala: Universitet, 2003
15. Agriculture of the Kaliningrad Oblast: Statistical Digest. Kaliningrad: Federal State Statistics Service, 2014.
16. Statistical Yearbook of Agriculture 2014. Warszawa: Central Statistical Office, 2015.
17. Rural settlements: Statistical Digest. Kaliningrad: Federal State Statistics Service, 2014.
18. “Fertilisation and chemical land reclamation in 2014”, Statistical Yearbook. Kaliningrad: Federal State Statistics Service, 2015 22p.
19. “Regional Development Strategy of the Voivodeship of Warmia and Mazury until 2020”, Annex to Resolution, vol. XXXIV/ 474/05. Voivodeship of Warmia and Mazury of 31 August 2005.
20. Population projection for Poland 2008-2035. Warszawa: Central Statistical Office, 2009.
21. Strategy of socio-economic development of the Kaliningrad Oblast till 2020, vol. 583. Kaliningrad: Governor of the Kaliningrad region, August 2012.
22. State of the environment and its impact on the health of the population of the Kaliningrad Region in 2007. Kaliningrad: Federal State Statistics Service, 2008.
23. Baltic Sea Action Plan, Krakow: HELCOM ministerial meeting. November 2007.