


Россия
Россия
BISAC NAT010000 Ecology
BISAC NAT045050 Ecosystems & Habitats / Coastal Regions & Shorelines
BISAC NAT025000 Ecosystems & Habitats / Oceans & Seas
BISAC NAT045030 Ecosystems & Habitats / Polar Regions
BISAC SCI081000 Earth Sciences / Hydrology
BISAC SCI092000 Global Warming & Climate Change
BISAC SCI020000 Life Sciences / Ecology
BISAC SCI039000 Life Sciences / Marine Biology
BISAC SOC053000 Regional Studies
BISAC TEC060000 Marine & Naval
The relevance of the polar lows (PLs) research is justified by their great destructive power and creation of threat to the safety of navigation in the high latitudes and along the Northern Sea Route. The most dangerous effects on maritime activities are strong winds, waves and icing. In addition, the study of the PLs acquires relevance due to the sharp decrease of the sea ice area in the Arctic in recent years and the emergence of areas of open water, suitable for the appearance and development of PLs. However, despite the importance of PLs, they are apparently not sufficiently studied. As there are no meteorological observations in the areas of their appearance, the main source of information about them are satellite observations. By using images on the SOLab SIOWS Arctic Portal from multiple satellites operating in the IR and visible ranges (e.g., MODIS and AVHRR), and using near-water wind fields from high resolution synthetic aperture radars (Sentine-1, ASAR) and low resolution scatterometers (ASCAT), we identify polar lows in various parts of the Arctic, revealing statistical regularities in the appearance of PLs, their distribution and intensity. Collected database of Pls and their characteristics will be used for further PLs forecasting model development.
Polar low detection, remote sensing, IR and visible images, near-water wind field, high and low resolution radars, Arctic, web GIS
I. Introduction
Polar lows (PLs) are short-term, but very intensive, atmospheric mesoscale cyclones formed over the ice-free sea surface to the pole of the main baroclinic zone (the Polar Front or other extensive baroclinic zones). The characteristic spatial size of these vortex formations is less than 1000 km, and the time of life, usually no more than 1-2 days. Thus, it is not possible to detect PLs on synoptic charts. Usual near-water wind speed of the developed PL is more than 15 m/s, which is its main feature that allows to identify them in a separate subclass of mesoscale cyclones. These definition and set of criteria became conventional since their publication by [1].
II. Objective
Main goal of this work is to extend the climatology of the PLs published in [2] over the seas of the North European Basin (Barents, Kara, Norwegian and Greenland Seas) for the period from 2009 to 2016. Determine coordinates and lifetime of identified PLs using synergistic analysis of satellite data, including satellite spectral radiometers MODIS and AVHRR, scatterometers (METOP ASCAT, QuikSCAT SeaWinds) and high resolution synthetic aperture radars (SAR) data (Sentinel-1, ASAR) for the period from 2009 to 2016. Further, it is planned to analyze the spatial and temporal distribution of PLs and their characteristics, and identify conditions influencing their formation and evolution. Storm Ice Oil Wind Wave Watch System (SIOWS) Arctic Portal (http://arctic.solab.rshu.ru/) designed by the Satellite Oceanography Laboratory (SOLab) of the RSHU is chosen to be the main tool for this study.
III. Data and Methods
Envisat ASAR Synthetic Aperture Radar
High-resolution SAR imagery is a good tool for PLs research, as they have the highest spatial resolution (up to tens of meters), provide information on wind field above the ocean regardless of light, and weather conditions.
Because high wind speed values are indispensable attribute and feature of the PLs, the analysis of radar data not only helps in identifying and isolating of PLs from groups of less intensive mezo-scale vorticities, but also can give valuable information on the internal structure of the PL for further modeling and forecasting.
Unfortunately, this tool is not good for permanent monitoring of the development of the Polar lows, because SAR scenes are irregular distinguished and have low temporal resolution, while PLs dissipate too quickly. In addition, SAR imagery is done not on regular bases, which means it is impossible to create detailed statistics of PLs based only on SAR data. At the same time, radar images are more informative regarding the images of visible and infrared ranges, because they allow to estimate the speed of the near-water wind.
Metop-A, B ASCAT and QuikSCAT SeaWinds Scatterometers
Scatterometer data provide regular information on wind field over the ice-free sea surface, characterized by a lower spatial resolution (25x25 km or 12.5x12.5 km), in contrast to the Envisat ASAR, but with higher temporal resolution, up to 15 times a day in Polar Regions. Scatterometer data extends the advantages of SAR imagery. These instruments are considered as a fundamental source of information about PLs.
In Fig. 1 one can see an example of a PL in QuikSCAT and ASCAT scatterometer imagery. In this example, the wind speed is more than 15 m/s, which allows us to consider this case as a PL.
NOAA AVHRR and MODIS Terra spectral radiometers
Infrared radiometers installed on polar orbiting satellites, such as AVHRR of the NOAA satellite series are among the most informative among infrared tools for the Polar Regions. Infrared images are a traditional tool for studying cyclones of different scales. Infrared images provide information on the location of the cyclone and the temperature of the upper layers of clouds. AVHRR data has the longest time series and high temporal resolution in Polar Regions, which allows determining the polar low lifetime.
Fig. 2 reveals us an example of an infrared image, in which the PL appears in the field of clouds.
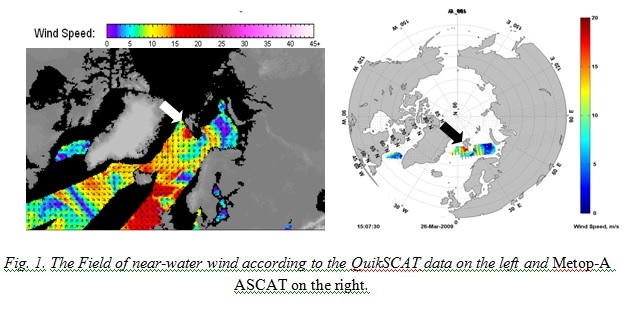
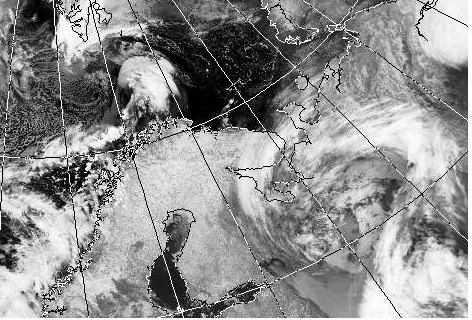
Formation of a PL is verified by evaluating the maximum speed of the near-water wind speed. As shown in Fig. 1 the wind speed was > 15m/s. Further, according to the AVHRR instrument we check the cloudy signatures corresponding to this PL. As one can see on Fig. 2, the PL signatures in clouds on infrared image are well manifested and correspond to the PL signatures in the near-water wind field.
Images from AVHRR and MODIS radiometers allow to obtain qualitative information on the clouds accompanying PLs and track PLs development. Having regular and high temporal resolution allows considering air masses and physical processes involved in the formation of the PL, providing information about the form and structure of clouds associated with the PL.
Example of a MODIS optical image in pseudo RGB, in which the PL is well seen through manifestation in clouds, shown in Fig. 3.
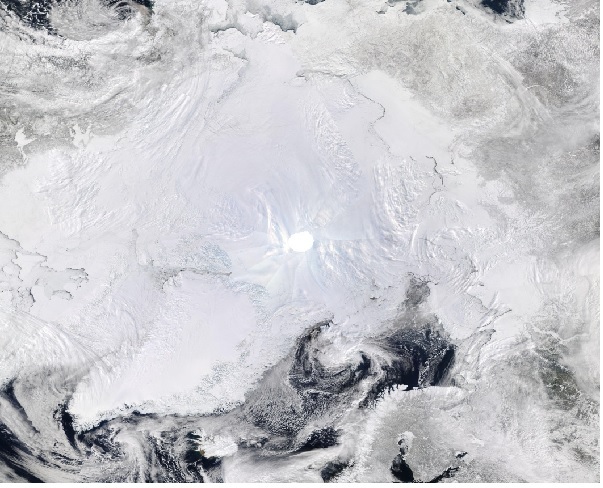
Fig. 3. Clouds as seen in the visible range according to the MODIS data.
An arrow on the southwest coast of Svalbard points out a polar low well seen through manifestation in clouds, 26 March 2009.
Cloud signatures on the optical images in the visible range are consistent with the manifestation of the PL in the near-water wind field.
The results of PLs identification are stored in a worksheet with PLs characteristics over the North-West Basin. One can see an example of such a worksheet in Table 1.
Table 1. Example worksheet with PLs characteristics
|
Date |
Coordinates, lat/lon |
Area of the sea |
Time of origin |
Lifetime, hours |
Max wind speed, m/s |
|
19.03.2009 |
1)-42.44; 60.42; 2)- 24.12; 71.44 |
1) North-east of the Norwegian of the sea; 2) The southern coast of Greenland |
1)04.00; 2)05.00 |
1)04.00-11.00; 2)05.00-20.00 |
1)20; 2)20 |
|
20.03.2009 |
-41,66; 62,69 |
North-west of the Norwegian Sea, the south-east coast of Greenland |
1.00 |
01.00-04.00 |
29 |
|
23.03.2009 |
-44,01; 54,35 |
South-west coast of Greenland |
01.00 |
01.00-05.00 |
25 |
|
24.03.2009 |
|
|
|
|
|
|
25.03.2009 |
1)-21,06; 66,55; 2)-39,91; 65,00 |
1) North-west of Iceland, north-western part of the Norwegian Sea; 2) South-east coast of Greenland |
1)1.00; 2)6.00 |
1)1.00-5.00; 2) 6.00-10.00 |
1)16; 2)25 |
|
26.03.2009 |
11,55; 77,94 |
Northeast Greenland Sea, south-west coast of Spitsbergen |
1.00 |
1.00-12.00 |
26 |
|
28.03.2009 |
-39,77; 64,69 |
West Norwegian Sea, south-east coast of Greenland |
02.00 |
02.00-09.00 |
23 |
|
29.03.2009 |
-20,75; 66,40 |
South Greenland Sea, north-west of Iceland |
2.00 |
02.00-8.30 |
28 |
|
30.03.2009 |
1) -21.43; 66.46; 2) |
1) North-west coast o.Islandiya; 2) South-east coast of Greenland |
1)10.00; 2)2.00 |
1)10.00-14.00; 2)2.00-22.00 |
1)18; 2)16; |
|
01.04.2009 |
-19.75; 64.40 |
North-west coast of Iceland |
1.00 |
1.00-14.00 |
19 |
|
02.04.2009 |
-42.61;62.38 |
The southern coast of Greenland |
9.00 |
10.00-20.00 |
24 |
|
03.04.2009 |
9.11 ; 79.46 |
The west coast of Spitsbergen |
09.40 |
09.40-13.00 |
17 |
Stages of work
PLs detection method used in this work for the whole period of the study includes the following steps:
1. Identification of potential PLs analyzing vorticity of the wind field (or just small areas of strong winds > 15 m / s) according to the wind field from ASCAT/QuickSCAT scatterometers.
2. Selecting images with cloud cover and investigation of cloud signature for identified PLs - according to MODIS and AVHRR imagery
3. Comparing wind field with manifestation of PLs in clouds.
4. Adding identified PLs to the database and estimating following parameters:
- Center coordinates (approximate to a certain point, when there is maximum development of cloudiness)
- Region (sea, marine area, ice extent)
- Time of origin (date, time);
- Life time (approximately);
Future stages of work
- Determination of the maximum wind speed during life-time period;
- Determination of the distance to the sea ice edge;
- Determination of ice concentration on the sea ice edge, closest to the PL.
- Analysis of spatial and temporal distribution of PLs and their characteristics,
- Identification of the conditions influencing PLs formation and evolution;
- Selection of different case studies with PLs over open water and over sea ice edges
- Usage of model data reanalysis from ERA Interim and WRF for future modeling of the selected case studies.
IV. Conclusion
Synergistic analysis of different optical, scatterometer and high-resolution SAR satellite images was carried out to create a climatology of PLs characteristics over the seas of the North European Basin (Barents, Kara, Norwegian and Greenland Seas) for the period from 2009 to 2016.
In the future, this climatology will be used to analyze the spatial and temporal distribution of PLs and their characteristics, and to identify conditions influencing their formation and evolution, including sea ice conditions.
V. Acknowledgments
The study is funded by the Russian Science Foundation through the Project #16-17-00122.
1. E. A. Rasmussen and J. Turner, Polar lows: mesoscale weather systems in the polar regions. Cambridge: Cambridge University Press, 2003.
2. J. E. Smirnova, P. A. Golubkin, L. P. Bobylev, E. V. Zabolotskikh, and B. Chapron, “Polar low climatology over the Nordic and Barents seas based on satellite passive microwave data,” Geophys. Res. Lett., vol. 42, no. 13, pp. 5603-5609, Jul. 2015.