


BISAC NAT010000 Ecology
BISAC NAT045050 Ecosystems & Habitats / Coastal Regions & Shorelines
BISAC NAT025000 Ecosystems & Habitats / Oceans & Seas
BISAC NAT045030 Ecosystems & Habitats / Polar Regions
BISAC SCI081000 Earth Sciences / Hydrology
BISAC SCI092000 Global Warming & Climate Change
BISAC SCI020000 Life Sciences / Ecology
BISAC SCI039000 Life Sciences / Marine Biology
BISAC SOC053000 Regional Studies
BISAC TEC060000 Marine & Naval
Sivash bay is the shallow-water lagoon of the Azov Sea. Restricted water exchange and high evaporation form Sivash as the basin with very high salinity. This factor leads to different from the Azov Sea thermal and ice regimes of Sivash. Maine aim of the study presented to investigate recent state and changes of the characteristics and processes in the basin using satellite data. Landsat scanners TM, ETM+, OLI, TIRS together with MODIS and AVHRR were used. Additionally NOMADS NOAA and MERRA meteorological data were analyzed. The next topics are discussed in the work: 1. Changes of the sea surface temperature, ice regime and relation with salinity. 2. Coastal line transformation – long term and seasonal, wind impact. 3. Manifestation of the Azov waters intrusions through the Arabat spit, preferable wind conditions.
Azov Sea, Sivash, satellite data, coastal dynamic
I. Introduction
The Sivash bay – is shallow-water lagoon, separated from Azov Sea by the Arabat spit. The bay has complex orography and forms evaporative lagoon with high salt concentration. Sivash is conventionally divided into four parts: the Western, the Middle, the Eastern and the Southern. The Western and the Middle basins are separated from Azov Sea by man-made levee, the Eastern Sivash is connected with Asov Sea through Tonkiy strait. Restricted water exchange, high evaporation and high salinity lead to different from the Azov Sea thermal and ice regimes of the Sivash. Maine aim of the study presented is to investigate recent state and changes of the characteristics and processes in the basin using satellite data. Landsat scanners TM, ETM+, OLI, TIRS together with MODIS and AVHRR were used. Additionally NOMADS meteorological data were analyzed. Map of the Sivash with main geographical names used presented on fig1.
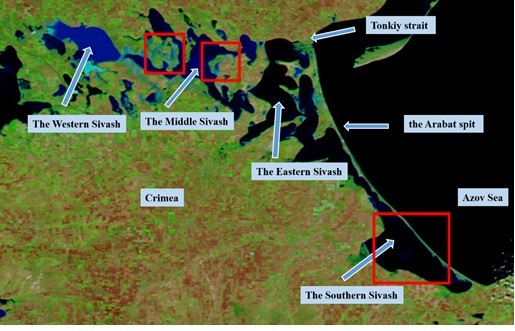
Fig. 1. Map of the Sivash with main toponyms. Red rectangles show areas analyzed in the next topics.
II. Sea surface temperature and ice regime
MODIS TERRA monthly mean Sea Surface Temperature (SST) data for 2001-2013 years were used for investigation of the interannual variability. Fig 2 demonstrates SST time set (upper panel), mean seasonal variability for the Southern Sivash and Azov Sea (low left panel) and difference between these data sets (low right panel). Maximum interannual variations of the monthly mean temperatures for the Southern Sivash were observed for March (from 4 Co to 8Co) and November (from 6Co to 12Co). As more shallow area Sivash demonstrates faster warming in spring-summer and faster cooling in fall –winter. Mean SST difference between Azov and Sivash exceeds 2.5Co for March.
The warmest year was 2010 (August temperature -30 Co) and the coldest years were 2006, 2008, 2012 when winter temperatures below zero in the Sivash and Azov have been registered. High difference in salinity strongly affects ice coverage in different parts of the Sivash. MODIS map for 21.01.2006 (fig 3) demonstrates situation with free of ice high salinity parts of the Sivash due to the low ice point for saline waters. Note that air temperature for this day was - 19 Co.
Difference in salinity is the main parameter defining duration of the ice coverage between Azov and Sivash. Data for ice regime for coldest years shown in table 1. Duration of Sivash ice regime is shorter than the ice regime of the Azov Sea, which is associated with a higher salinity of Sivash water and as a consequence with later freezing and earlier melting of the ice cover. For example, in the winter of 2008 the ice regime in Sivash was 77 days (from 18.12.07 up to 04.03.08), and ice regime of Azov Sea - 84 days (from 18.12.07 up to 11.03.08).
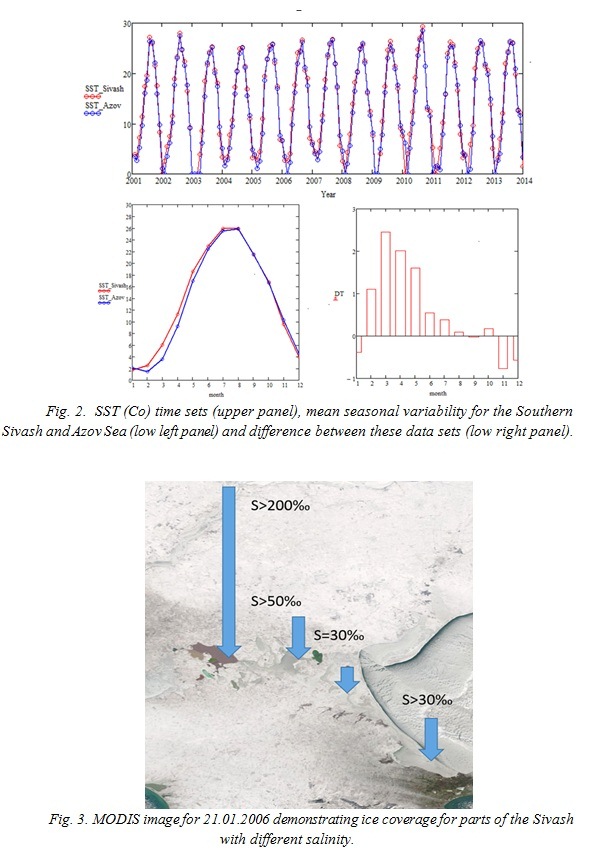
Table 1. Ice regime for the Sivash and Azov Sea
|
|
The Sivash |
Azov Sea |
||||||
|
Year |
First ice formation |
Full ice melting |
The duration of the ice regime (days) |
Year |
First ice formation |
Full ice melting |
The duration of the ice regime (days) |
|
|
1 |
2006 |
21.01 |
23.03 |
61 |
2006 |
09.01 |
28.03 |
79 |
|
2 |
2008 |
18.12 |
04.03 |
77 |
2008 |
18.12 |
11.03 |
84 |
|
3 |
2012 |
28.01 |
25.03 |
77 |
2012 |
20.01 |
10.04 |
81 |
So, two main factors define specific features of temperature regime of the Sivash – small depth and high salinity.
III. Coastal line transformation – long term and seasonal, wind impact
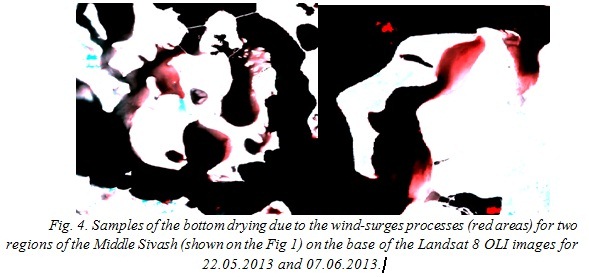
High resolution optical data from Landsat (4,5,7,8) scanners TM, ETM+, OLI allow to investigate coastal line transformation induced by level change and erosion of the coasts. These processes may be studied for different time intervals. Using data in the near IR spectral range we can easy separate water and land. RGB composition method was used for calculation of the combined maps by using images obtained for different dates. In such a way it’s possible to detect like short term variation of the coast line induced by wind-surges processes [6] such long term processes of the erosion or accumulation. For 1987 – 2013 years Landsat data with spatial resolution 30 meters were analyzed. Level change and wind-surges processes well detected on the images for the shallow Middle Sivash with depth 0.5-1m and set of dams. Samples of the wind-induced variation of the coastline are shown on the figure 4. Maps were calculated on the base of the two images (22.05.13 and 07.06.13) with different wind condition. Drying areas are colored in red color.
The similar RGB composition method was applied for study of the long term variation of the coast line. Satellite image with time interval 10-25 years were used for this aim. The Southern Sivash is characterized by biogenic sedimentation of shells and shelly sand [5]. This fact leads to generation of the different coastal accumulation forms like spits. Spits are variable forms under the wave and currents forcing. Typical sample of the spit shift presented on the figure 5. Map was created on the base of the two images obtained in 1987 and 2011 years. Blue color corresponds the position of the spit in 1987 year and yellow – for 2011 year. So, shift observed is 60-120 meters.
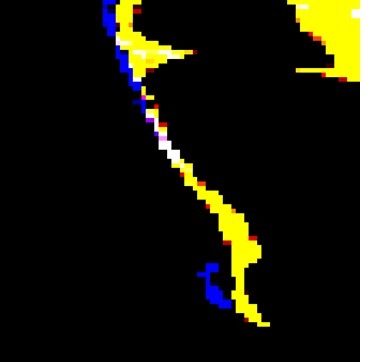
Fig. 5. RGB composition map on the base of the two images obtained in 1987 and 2011 years. Blue color corresponds the position of the spit in 1987 year and yellow – for 2011 year.
IV. Manifestation of the Azov waters intrusions through Arabat spit, preferable wind conditions
Sivash bay is separated from Azov Sea by Arabat spit or Arabatskaya Strelka spit with 112 km length and of 0.25 to 8 km width. Spit height in the northern part is up to - 10 m, while the southern spit part does not exceed 3 meters above Azov Sea level. The southern part of spit is characterized by development of several ridges with gentle slopes, separated by troughs. Ridges are put from small - and medium-grained sand, and the bottom of hollows – sand-oozy material. Both on ridges, and in hollows the abundance of a shell is noted, that says that spit is put by the material which has arrived from a seabed [1]. It follows from the data provided by A.M. Ponizovsky in [3] that filtration of waters of the Sea of Azov through the Arabat spit is insignificant, these conclusions have been done on the basis of actual material consideration – results of deep drilling of 132 wells regarding the Arabat spit adjacent to Sivash throughout the coastline of the Southern Sivash, and also experiments on definition of a filtration of soil, besides in 1959 — 1962. The Crimean complex geological expedition studied again a question of inter-relation between Sivash brines and water of the Azov Sea. The expense of Azov waters stream to the Southern Sivash has been calculated: 7360 m3 per day, or 115 thousand m3 per year [3]. Such kind of works weren't carried out in the Southern Sivash later.
MODIS, OLI and TIRS date were used for study of the spatial features of the temperature and optical properties of the waters along Arabat spit in the Southern Sivash. Data for 2014 and 2015 years were used for these purposes. Time by time we can detect in the thermal images of the TIRS more cold jets from spit to the Sivash. Note that such jets are observed usually in the same parts of the spit. Typical sample shown on the figure 6(a) – TIRS image for March 9 2015. Jets look like more dark stripes. Specific features approximately in the same places along spit are observed in MODIS (08.08.2015) optical images like areas with more clean waters with low scattering Fig 6 b( more dark areas). Analysis of the NOMADS NOAA wind data [2] for situation with such manifestation along spit gave the result – all images with jets were obtain during or after strong (>10-15m/s) East or North-East wind. Sample of the wind map for 08.08.2015 shown on the fig 6(c). Typically, these winds induce level rising along Azov side of the spit up to 1m [6]. The same winds can decrease level along Sivash side of the spit. So, we have preferable condition for increasing possible intrusion of the Azov waters through the spit due to the level difference on Azov and Sivash sides. Finally on the 1m resolution image from Google Earth well seen structure that may be interpreted like bed of flow on the bottom. Note, that position of this bed corresponds the place of most often manifestation of the jets in optical and thermal images.
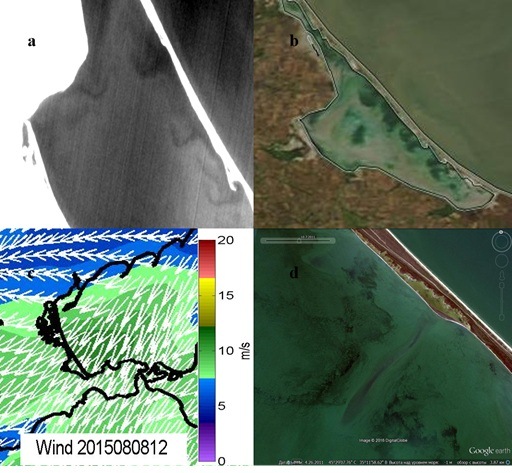
Fig. 6. Azov water filtration through the Arabat spit 08.08.2015 (a) - in the thermal infrared range, (b) - in the optical image of MODIS 08.08.2015, (c) - the scheme of wind conditions, m/s (d) – High resolution image from Google Earth )
V. Conclusions
On the base of satellite data were investigated thermal and ice regimes of the Sivash. Two main factors define specific features of temperature and ice regime of the Sivash – small depth and high salinity.
RGB composition method demonstrated coast line transformation induced by level change and erosion of the coasts.
Detected specific spatial features (jets) in optical and thermal images may be interpreted like manifestation of the Azov waters intrusion throw the Arabat spit. All situation with jets manifestation followed by strong (>10-15m/s) East or North-East wind. Additional experimental “in situ” measurements need to confirm water intrusion in detected areas.
VI. Acknowledgment
This study is supported by grant RScF, project №15-17-20020
1. V. K. Leontiev and A.K. Leontiev, “Main features of geomorphology of Sivash lagoon,” Vestnik MSU. Ser. of “Georg.”, №2, pp. 185-194, 1956. (in Russian).
2. http://dvs.net.ru/mp/data/main_ru.shtml - Marine portal by Remote Sensing Department of FSBSI MHI
3. Ponizovsky, Salt resources of the Crimea. Simferopol: Crimea,1965. (in Russian).
4. V.P. Zenkovich, The Fundamentals of the theory of the development of coasts. Moscow: publ. house of the USSR Ac. Of Sc., 1962. (in Russian).
5. V.A. Mikhailov, “Free and detached coastal accumulative forms of Sivash bay,” Sc. Not. of Taurida Nat. V.I. Vernadsky Univ. Ser. Geogr., 27(66),№2, pp. 65-74, 2014. (in Russian).
6. O.D. Davidov, “Physical-geography characteristics of windy flat coast in Sivash bay (within the western, central and eastern sites),” Odesa Nat. Univ. Herald, 12(8), pp. 62-70, 2007. (in Ukrainian).