


Россия
BISAC NAT010000 Ecology
BISAC NAT045050 Ecosystems & Habitats / Coastal Regions & Shorelines
BISAC NAT025000 Ecosystems & Habitats / Oceans & Seas
BISAC NAT045030 Ecosystems & Habitats / Polar Regions
BISAC SCI081000 Earth Sciences / Hydrology
BISAC SCI092000 Global Warming & Climate Change
BISAC SCI020000 Life Sciences / Ecology
BISAC SCI039000 Life Sciences / Marine Biology
BISAC SOC053000 Regional Studies
BISAC TEC060000 Marine & Naval
Container yards tend to be located along waterfronts that are exposed to high risk of storm surges. However, risk assessment tools such as vulnerability functions and risk maps for containers have not been sufficiently developed. In addition, damage due to storm surges is expected to increase owing to global warming. This paper aims to assess storm surge impact due to global warming for containers located at three major bays in Japan. First, we developed vulnerability functions for containers against storm surges using an engineering approach. Second, we simulated storm surges at three major bays using the SuWAT model and taking global warming into account. Finally, we developed storm surge risk maps for containers based on current and future situations using the vulnerability function and simulated inundation depth. As a result, we revealed the impact of global warming on storm surge risks for containers quantitatively.
Storm surge, Container, Global warming, Vulnerability functions.
The storm surge due to Typhoon Melor (2009) caused significant losses to 136 containers at Mikawa Port in Japan [1]. Since non-life insurance companies prepare insurance coverages that indemnify seawater invasion, owners of containers are able to transfer their storm surge risks to insurance companies. However, risk assessment tools such as vulnerability functions and risk maps for containers have not been sufficiently developed. Hence, it is necessary to improve them in order to take effective measures for loss prevention.
The Assessment Report of the IPCC (2014) states that tropical depressions will become more intense than in the present climate, and the expected sea level rise by the end of the 21st century is in the range 0.45 m–0.82 m [2]. According to Japanese government reports, the land area below sea level in the three major bays will expand to 150% of its current value, and damage due to storm surges is expected to be increased by global warming [3].
This study assesses storm surge impact by global warming for containers located at three major bays. Development of vulnerability functions for containers is described in Chapter II. Chapter III explains the storm surge simulation used. Chapter IV presents the inundation area and mean damage ratio of containers depending on different scenarios. Conclusions are summarized in Chapter V.
- Development of vulnerability functions for containers
To analyze storm surge loss for containers, vulnerability functions are developed using an engineering approach with some assumptions. In this study, we propose a new approach for vulnerability functions and develop it using representative parameters. First, we determine damage modes by establishing an event tree of containers encountering storm surges. Second, we theoretically analyze the damage to containers corresponding to storm surge inundation depth for each damage mode. Finally, we integrate the damage distribution of each damage mode and create vulnerability functions for containers. Since containers are loaded in container yards, we create vulnerability functions for four types of container stacks.
Establishment of damage modes
We establish an event tree for container damage due to storm surges, as shown in Fig. 1. Inundation and floating of containers are configured as storm surge damage modes. Collision with other containers or debris and container ignition by chemicals are not considered. We assume that containers float with increasing storm surge inundation depth after containers are flooded . We set Ri as the damage ratio to containers due to a storm surge and assume that Ri becomes 1 when containers float.
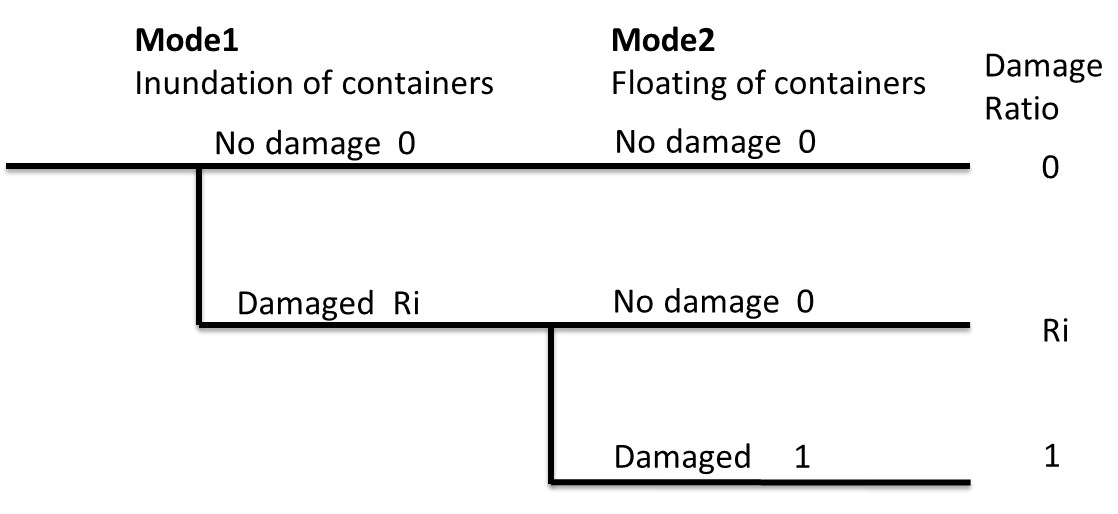
Fig. 1. Event tree of vulnerability functions for containers.
Data acquisition
There are many container types. Almost all containers used in Japan are 20- or 40-foot containers. According to the report by MLIT, the usage rates of the 20- and 40-foot varieties are 26% and 74%, respectively [4]. We utilized this as a ratio to combine damage distributions. Parameters used for analysis are given in Table 1 [5].
Table 1. Parameters of containers.
|
|
20-ft Container |
40-ft Container |
|
Length (m) |
6.058 |
12.192 |
|
Width (m) |
2.438 |
2.438 |
|
Height (m) |
2.591 |
2.591 |
|
Weight of container (kg) |
2,365 |
4,000 |
|
Average weight of load (kg) |
14,400 |
10,600 |
Inundation of containers
Containers are not damaged until water reaches a depth of 15 cm owing to the assumption that only at 15 cm above ground are containers permeable. We assumed 0.5-m inundation depth at a 0.5 damage ratio and 1.0-m inundation depth at a 1 damage ratio. The damage distribution by inundation is shown in Fig. 2. The upper container is not damaged by inundation. Therefore, stacks with many containers are less vulnerable than those with few containers.
Floating of containers
Containers float due to lift and buoyant forces corresponding to the inundation depth. The weight of a container, which determines whether it floats, is defined as the sum of the deadweight of the container and the average weight of the load, as shown in Table 1. It is assumed that, when the bottom container floats, not only the second but also the third, fourth, and higher containers in the stack fall into the surrounding water. Total loss of cargo is postulated because water enters a container within a short time. Fig. 2 presents the average damage distribution by floating for various numbers of containers in stacks. Since a larger number of stacked containers is heavier, it is not as vulnerable to floating.
Vulnerability functions
As shown in Fig. 2, vulnerability functions are developed from combined damage distributions. It stands to reason that low stacks are more vulnerable because of their lower total height and total weight.
.jpg)
Fig. 2 Damage function developed in this study.
- Description of storm surge simulation
Numerical simulation model
To analyze storm surges in major three bays in Japan, the coupled model of surges, waves, and tides (named SuWAT), developed by Kim et al. (2008), was used [6]. The SuWAT model, composed of depth-integrated nonlinear shallow water equations and a simulated waves nearshore (SWAN) model, is able to run simultaneously with an arbitrary number of nested domains by using the message passing interface (MPI).
The storm surge model was modeled to incorporate tides, wet-dry treatment for tidal flat ground, and wave-induced radiation stress. The basic equations (1)–(3) are the depth-integrated nonlinear shallow water equations:
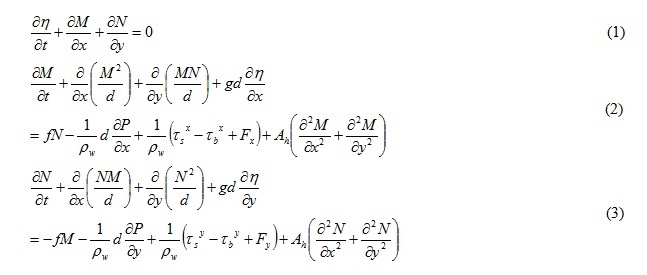
in which η is the sea surface elevation, M and N are the components of depth-integrated velocity in the x and y directions, P is the atmospheric pressure, f is the Coriolis parameter, g is the gravitational acceleration, d is the total water depth (η+h), Ah is the horizontal eddy diffusion, ρw is the density of water, τb is the bottom stress, τs is the water surface stress, and Fx and Fy represent the components of wave-induced radiation stress. These equations are discretized by using the staggered Arakawa C grid in space and the leapfrog method in time.
SuWAT covers a computational domain extending from the bays in the Pacific Ocean to encompass the full meteorological fields of typhoons. The complexity of geophysical features was taken into account by using a three-level grid system. In this study, the outer domain (D1) is constituted by 2,730 m × 2,730 m squares, the middle domain (D2) by 270 m × 270 m squares, and the smallest domain, which covers the entirety of the bays, by 90 m × 90 m squares. The water depth, elevation, and Manning coefficient ware derived from the data published by the Cabinet Office, Government of Japan.
Overview of government scenarios
The Japanese government prepares for the worst-case hazard map in major three bays [7–9]. Tables 2–4 describe overviews of the government scenarios, which are classified by the initial water level, typhoon intensity, and levee condition. Some scenarios include the effect of global warming, as the IPCC (2007) expects global average water level to increase by at most 59 cm [10]. Every scenario includes the effect of global warming in the initial water level by adding additional water height to the H.W.L.
The government sets typhoon intensities as those of typhoon Muroto, Vera, and Nancy. Typhoon Muroto, for which the minimum central pressure was 893 hPa, seriously damaged the western part of Japan in 1934. Typhoon Vera induced serious storm surge damage at Nagoya in 1959. Its central pressure was 954 hPa at Nagoya. Typhoon Nancy caused extensive storm surge damage at Osaka Bay, and its minimum central pressure was 880 hPa. The typhoon intensity of the Tokyo and Ise Bay scenarios correspond to Vera- and Muroto-class typhoons. Whether these scenarios included the effects of global warming in typhoon intensity was not mentioned. On the other hand, using the intensity of Typhoon Nancy in the Osaka Bay scenario indicates that future intensity is expected to be affected by global warming.
Therefore, the scenarios of Tokyo Bay and Ise Bay include the effect of global warming in the initial water level. However, the Osaka Bay scenario takes into account the effect of global warming not only in initial water level but also in the intensity of Typhoon Nancy.
Table 2. Overview of government scenarios for Tokyo Bay.
|
Tokyo |
Scenario A |
Scenario B |
Scenario C |
Scenario D |
Scenario E |
Scenario F |
|
Water level |
H.W.L |
H.W.L +0.6m |
||||
|
Typhoon intensity |
Vera |
Muroto |
Vera |
Muroto |
||
|
Condition of floodgate |
Close |
Open partially |
Close |
Open |
||
Table 3. Overview of government scenarios for Ise Bay.
|
Ise |
Case1 |
Case2 |
Case3 |
Case4 |
Case5 |
Case6 |
Case7 |
Case8 |
|
Water level |
M.S.L |
H.W.L |
H.W.L +0.24m |
H.W.L +0.59m |
M.S.L |
H.W.L |
H.W.L +0.24m |
H.W.L +0.59m |
|
Typhoon Intensity |
Vera |
Muroto |
||||||
Table 4. Overview of government scenarios for Osaka Bay.
|
Osaka |
Scenario I |
Scenario II |
Scenario III |
|
Water level |
H.W.L |
H.W.L +0.2m |
H.W.L +0.2m |
|
Typhoon intensity |
Vera |
Nancy at Okinawa |
Nancy at Okinawa |
|
Levee failure |
Included |
Not included |
Included |
Setting scenarios for the present study and model validation
The government analyzed the worst typhoon course for each bay. Although Tokyo and Osaka Bays have only one typhoon course, Ise Bay has several courses depending on geography because the shape of Ise Bay is very complicated. Mie prefecture, located on the west side of Ise Bay, has no storm surge hazard map.
In this study, we adopted typhoon courses predicted by the government. For Tokyo and Osaka Bays, we utilized each government typhoon course. For Aichi in Ise Bay, the typhoon courses of Typhoons Vera, Tip, and Carman were used. For Mie in Ise Bay, we determined the worst typhoon courses by using the government methodology. First, we analyzed the maximum storm surge of 78 historical typhoon courses using the intensity of Typhoon Vera. Second, we translated courses in parallel and rotated them, then simulated the maximum storm surge to adopt the worst typhoon courses corresponding to the coastal area. We adopted the course of Typhoon Vera translated by -0.2°, and rotated by -22.5° for Mie. Fig. 5 illustrates the adopted typhoon courses
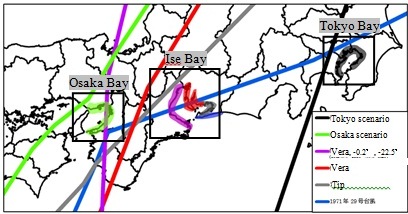
Fig. 5 Adopted typhoon courses.
Prior to simulating the storm surge effect of global warming, we validated the storm surge model by reproducing storm surges from historical and government scenarios, as shown in Fig. 6. Historical Typhoon Irma was utilized for validation of the Tokyo Bay model. The storm surge in Ise Bay was validated by reproducing Typhoons Vera, Tip, and Carmen from government scenarios for Aichi prefecture, and historical Typhoon Vera for Mie prefecture. The storm surge in Osaka Bay was reproduced by the government scenario. Validation results indicated that the simulation model generally reproduced storm surges well
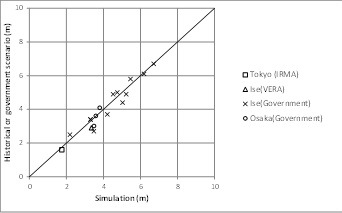
Fig. 6 Validation results for maximum storm surge.
We calculated storm surges and evaluated the effect of global warming on them. First, government scenarios, which did not take global warming into account, were simulated. Second, scenarios considering water height rises were evaluated. Third, we calculated scenarios that consider the effect of global warming in water height and typhoon intensity.
According to the IPCC (2007), typhoon intensity will increase in the future. Kunutson and Tuleya (2004) mentioned the relationship between typhoon central pressure and radiative forcing [10]. They described that, when the radiative force increases by 4.2 W/m2, typhoon central pressure decreases by 14%. We utilized this relationship to incorporate the effect of global warming for typhoon intensity. Table 5 indicates scenarios we examined in this research. Typhoon intensity and water height were set to include the effect of global warming. Levee failure was not considered in the scenarios. Scenario 1 is the worst case for the current situation. Scenario 2 incorporates the water rise due to global warming. Scenario 3 includes not only the water rise but also the increase of typhoon intensity because of global warming.
Table 5. Calculation scenarios.
|
Calculation case |
Water height |
Typhoon intensity |
|
|
Tokyo Bay |
Scenario 1 |
H.W.L |
Muroto |
|
Scenario 2 |
H.W.L+0.82m |
Muroto |
|
|
Scenario 3 |
H.W.L+0.82m |
Muroto + increase of intensity |
|
|
Ise Bay |
Scenario 1 |
H.W.L |
Muroto |
|
Scenario 2 |
H.W.L+0.82m |
Muroto |
|
|
Scenario 3 |
H.W.L+0.82m |
Muroto + increase of intensity |
|
|
Osaka Bay |
Scenario 1 |
H.W.L |
Vera |
|
Scenario 2 |
H.W.L+0.82m |
Vera |
|
|
Scenario 3 |
H.W.L+0.82m |
Vera + increase of intensity |
|
- Results and discussions
Storm surge simulation
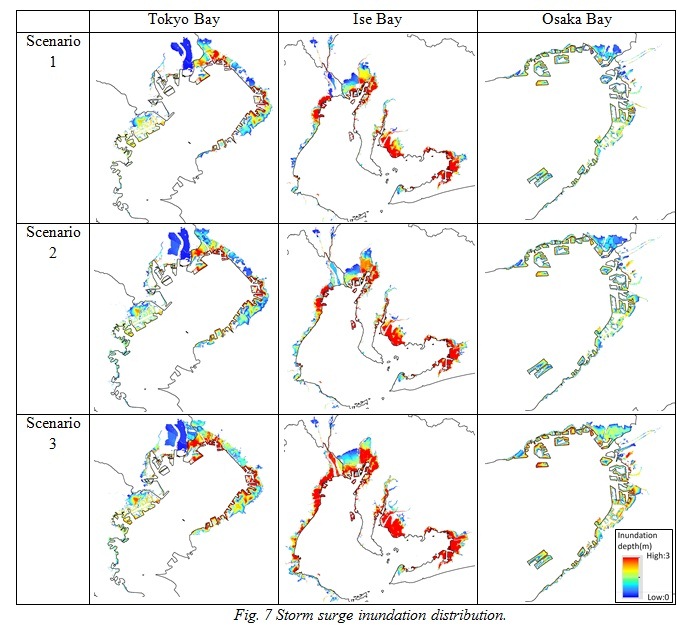
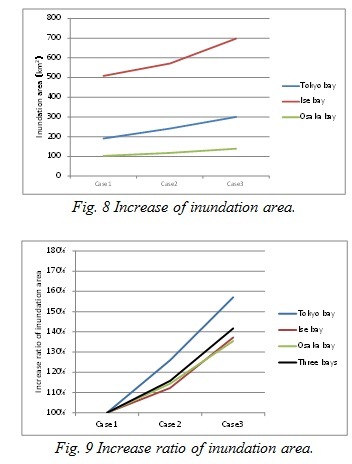
The storm surge inundation distribution was calculated as exhibited in Fig. 7. To evaluate the effect of global warming in three major bays, inundation area was compared for the three scenarios as shown in Fig. 8. This indicates that Ise Bay will increase the most in inundation area. It also reveals that the inundation area in Osaka Bay will increase the least. However, the ratio of the increase in inundation area is over 130% for all bays, as shown in Fig. 9. This result reveals that a change in the radiative force is more effective for increasing the inundation area ratio than a change in the water height.
Assessment of containers
Storm surge risk for containers was assessed by integrating the damage ratio at a container terminal. Firstly, the damage ratio was calculated using the three-stack damage function based on the inundation depth distribution. Secondly, the damage ratio distribution was extracted for the container terminals described in Fig. 10. Finally, the storm surge risk for containers was estimated from the following index. We analyze the mean damage ratio (MDR) as an index to assess storm surge risk for containers at container terminals quantitatively, as described in Eq. (4):

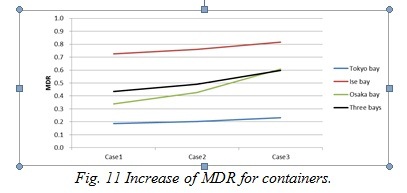
where DR is the damage ratio in mesh number k, and n is the total number of meshes in the container terminals. The calculated MDR is depicted in Fig. 11.
Container damage is increased for all three bays. Our results indicate that containers in Osaka Bay are especially influenced by global warming. The MDR in case 1 for the three bays is about 0.44 and is 0.60 in case 3. Therefore, global warming causes a rise in the MDR of containers for the three bays by 37%.
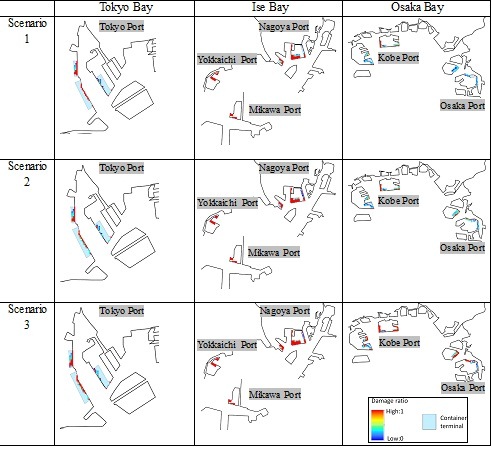
Fig. 10 Damage ratio distribution for the containers at container terminals.
- Conclusions
The present study demonstrated an increase of storm surge risk for containers in three major bays with global warming. To investigate quantitative risk, an index (MDR) was applied. The damage ratio for containers was converted from inundation depth using the suggested vulnerability functions. Our results reveal that global warming contributed to rises in inundation area of up to 42%. MDR will rise by 37% because of global warming.
Further study on vulnerability functions is required. In particular, understanding operations at container terminals is important. Although the number of containers in a stack varies during operation, our results were calculated by representative vulnerability functions. A new scheme to integrate vulnerability functions is needed.
1. K. Kumagai, “A survey of container drift damage in Mikawa Port caused by the storm surge of Typhoon No.18,” 2010 Annual Report of NILIM, Japan, 2010.
2. Intergovernmental Panel in Climate Change (IPCC), “Climate Change 2014: Synthesis Report,” IPCC, Geneva, Switzerland, 2014, pp. 13.
3. T. Okazumi, “Adaptation Strategy for Climate Change in Japan,” National Institute for Land and Infrastructure Management, Japan, 2008, Available at: http://www.mlit.go.jp/river/basic_info/english/pdf/conf_03-0.pdf> [Accessed 6 May 2016].
4. T. Watanabe, Y. Nita, R. Shibasaki and Y. Akakura, “An Examination on International Maritime Container Cargos Considering the Size of Container,” National Institute for Land and Infrastructure Management, Japan, 2008, pp. 6.
5. Naigai Nitto Co., Ltd., “Container size,” Available at:http://www.nnt.co.jp/ContainerSize.htm> [Accessed 30 April 2015].
6. S.Y. Kim, T. Yasuda, and H. Mase, “Numerical analysis of effects of tidal variations on storm surges and waves”, Applied Ocean Research, Japan, 2008, pp. 311-322.
7. Cabinet Office, Government of Japan, “Daikibo suigai taisaku ni kansuru senmon chosakai houkoku,” Available at: < http://www.bousai.go.jp/kaigirep/chuobou/26/pdf/shiryo4-2.pdf> [Accessed 6 May 2016].
8. Aichi Prefectural Government, “For the publication of Aichi prefecture, storm surge flooding expected,” Available at: < http://www.pref.aichi.jp/soshiki/kowan/0000077972.html> [Accessed 6 May 2016].
9. National Institute for Land and Infrastructure Management, “Osakawan takasio taisaku kikikanri koudou keikaku,” Available at: http://www.kkr.mlit.go.jp/plan/takashio/conference/05/pdf/takashio-guideline.pdf> [Accessed 6 May 2016].
10. Intergovernmental Panel in Climate Change (IPCC), “Climate Change 2007: Synthesis Report,” IPCC, Geneva, Switzerland, 2007, pp. 45.