


BISAC NAT010000 Ecology
BISAC NAT045050 Ecosystems & Habitats / Coastal Regions & Shorelines
BISAC NAT025000 Ecosystems & Habitats / Oceans & Seas
BISAC NAT045030 Ecosystems & Habitats / Polar Regions
BISAC SCI081000 Earth Sciences / Hydrology
BISAC SCI092000 Global Warming & Climate Change
BISAC SCI020000 Life Sciences / Ecology
BISAC SCI039000 Life Sciences / Marine Biology
BISAC SOC053000 Regional Studies
BISAC TEC060000 Marine & Naval
Sea radiance coefficient, defined as the ratio of the sunlight reflected by the water bulk to the sunlight illuminating the water surface, is one of the most informative optical characteristics of the seawater that can be obtained by passive remote sensing. We got the sea radiance coefficient spectra by processing the data obtained in measurements from board a moving ship. Using sea radiance coefficient optical spectra it is possible to estimate water constituents concentration and their distribution over the aquatory of interest. However, thus obtained sea radiance coefficient spectra are strongly affected by weather and measurement conditions and needs some calibration. It was shown that practically all the spectra of sea radiance coefficient have some generic peculiarities regardless of the type of sea waters. These peculiarities can be explained by the spectrum of pure sea water absorption. Taking this into account a new calibration method was developed. The measurements were carried out with the portative spectroradiometers from board a ship in the five different seas: at the north-east coast of the Black Sea, in the Gdansk Bay of the Baltic Sea, in the west part of the Aral Sea, in the Kara Sea with the Ob’ Bay and in the Philippine Sea at the coast of Taiwan. The new method of calibration was applied to the obtained spectra of the sea radiance coefficient that enabled us to get the corresponding absorption spectra and estimate the water constituents concentration in every region. The obtained concentration estimates were compared to the values obtained in water samples taken during the same measurement cycle and available data from other investigations. The revealed peculiarities of the sea radiance coefficient spectra in the aquatories under exploration were compared to the corresponding water content and some characteristic features were discussed.
optical passive remote sensing, sea radiance coefficient spectrum, sea water absorption, concentration of sea water phytoplankton, “yellow substance” and suspended matter, sea shelf, river mouths, inland seas.
I. Introduction
Recently, investigation of oceans and seas by satellite remote sensing in visible is used for estimation of water content and main water constituents distribution. However, for thorough study of the coastal zones and inland seas the algorithms developed for open ocean are not valid and some regional algorithms must be provided. That is why optical remote sensing from board a ship is of great importance. There have been a lot of works applying spectroradiometry from board a ship since the ninetieth of the last century (see, e.g., [1]-[4]). However, the results of such measurements are strongly affected by the wind, cloudiness and sea surface roughness as well as by experiment conditions. As a result one need either to restrict dramatically the suitable weather and experiment conditions (for instance, carry on measurements only with the clear sky and rather smooth water surface that is often impossible for some regions) or introduce some calibration method. The frequently used calibration method is based on the fact that water absorption in the long-wavelength range (more than 700 nm) makes the signal from the open ocean water bulk practically equal to zero, using it one can correct the coefficients in the sky reflecting part of the upward radiation. However, it is often not valid for the coastal zones and inland seas as the water scattering indices are much bigger there due to the enhanced suspended matter concentration.
In this article a new original calibration method is suggested. It gives the possibility not only to calibrate spectra measured in unsuitable weather conditions but also to obtain the estimates of sea water absorption spectra. After processing of thus obtained spectra we get the concentration of sea water main constituents in the region of interest. In this paper we show the application of such method for five different seas.
II. Details of measurements
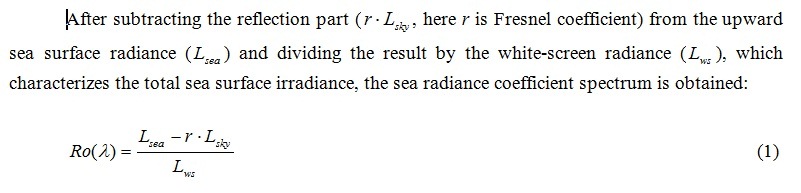
This paper presents the results of the study of waters in five seas - the Black Sea, the Baltic Sea, the Aral Sea, the Philippine Sea at the coast of Taiwan and the Kara Sea - using the passive optical remote sensing of water surface. As a result of measurements we obtained some spectra of the sea radiance coefficient (Ro(λ)), defined as sea–water radiance referred to the horizontal white diffuse reflector radiance, which is proportional to the total sea surface irradiance. In the process of determining the sea radiance coefficient from the ship we used the spectrometer (AVANTES), operating in the spectral band 360-760 nm with 5.5 nm resolution. At each point we obtained the sea radiance coefficient spectrum by successive measurements of the three spectra: firstly, the radiance of the upward radiation (Lsea ), which includes the intensity of the solar radiation backscattered by the sea water bulk and the intensity of light reflected by the sea surface; secondly, the radiance of the sky region, giving the largest contribution to the reflected radiation (Lsky); thirdly, the radiance of a white, horizontally disposed, diffuse reflector (Lws), which characterizes the total sea surface irradiance. Every spectrum was measured with appropriate integration time (from tenths of a second to several seconds) with the intervals between the successive measurements at each point no more than 1-2 minutes. Other researchers use similar techniques for carrying out optical measurements, sometimes the white screen is substituted with cosine collector to estimate the total irradiance of the water surface [4].
а
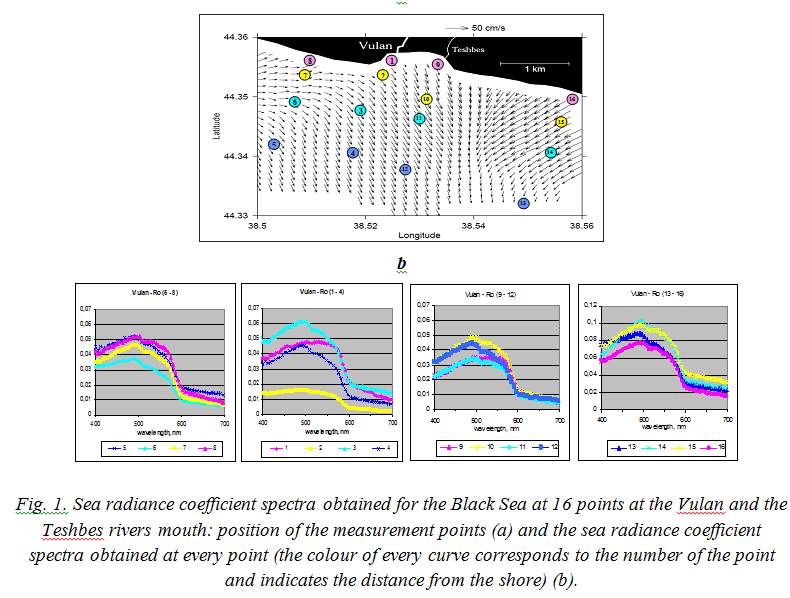
The sea radiance coefficient spectra obtained for 16 points using measurements from board a moving ship in the north-eastern part of the Black Sea are shown in Fig. 1.
The nadir angle was 25º-30º, azimuth angles provides the measurements from the board opposite to the sunlit one (the measurements were carried out from 8 a.m. to 3 p.m.) escaping the shade. The sky was partly clear and partly masked with fast moving clouds because of the windy day. The cloudy sky and the rough sea became the sources of the abrupt substantial changes of the spectra intensity.
Though the main water constituents concentration changes gradually from the rivers mouth to the open sea, one can see that the obtained Ro-spectra have rather chaotic appearance. That is the result of the fast changes in the conditions of water surface illumination, reflectivity of the wavy surface and difference in radiance of cloudy and non-cloudy sky areas. It is obvious some calibration is necessary for this kind of the experiment data.
II. New calibration method
By analyzing the sea radiance coefficient spectra demonstrated above and some other ones obtained by the same method in different aquatories, their common feature was revealed: regardless of the water content they all have so-called “step” – rapidly decreasing dependence in the section of the spectrum from 580nm to 600nm turns into less steep dependence from 600 nm to 700 nm. Since the main water constituents absorption and backscattering have no peculiarities in this spectral region (Fig. 2), the revealed “step” can be explained only by the peculiarities in pure sea water absorption spectrum (the review of the pure water absorption measurements is given in [5]). This explanation of the “step” appearance in the sea radiance coefficient spectra enables us to understand why practically all such spectra in coastal areas have abovementioned peculiarities. It should be mentioned that in open ocean waters such peculiarities also exist, however, they are practically not seen as the sea radiance coefficient value is negligibly small for more than 600 nm due to the relatively small backscattering index.
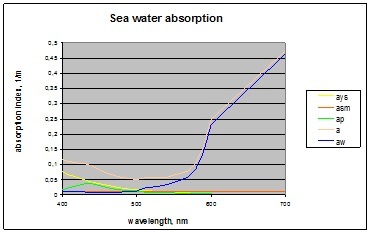
Fig. 2. Absorption spectrum of pure sea water – aw.(λ). For comparison an example of light absorption spectra by the three main natural water constituents (ays(λ) - absorption of “yellow substance”, asm(λ) - absorption of suspended matter, ap(λ) - absorption of phytoplankton pigments) and total sea water absorption spectrum is given.
There are three main sources for Ro errors: the instrumental errors, errors from the alternation of light intensity during the set of three measurements (Lsea , Lsky , and Lws ) and errors from the uncertainty of the reflected from the water surface part of Lsea , the first one being much smaller than the two others. Our calibration is aimed at the two sources of larger error. The revealed properties of the spectrum enable us to calibrate sea radiance coefficient spectra obtained by measurements. We assumed that the true spectrum (Ro*(λ)) is different from the measured one (Ro(λ)) and can be calculated with the help of two values:
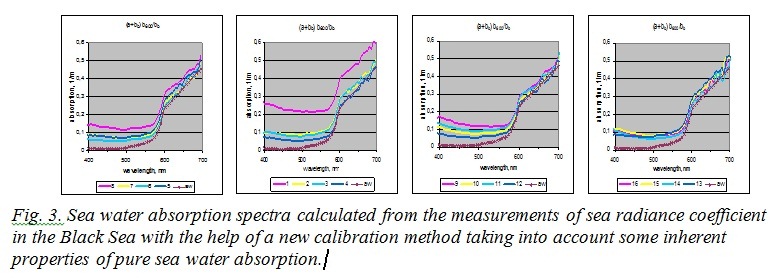
The suggested method was applied to the above given spectra of the sea radiance coefficient measured in the Black Sea (Fig. 1). Comparing the initial spectra and the spectra of water absorption after calibration one can see the positive effect: despite the unfavorable meteorological conditions all the resulting spectra show the decreasing of absorption with increasing distance from the Vulan and the Teshbes mouth (see Fig. 3). For example, the spectrum in the second plot derived from the measurements at point 1 (see Fig.1a), which is the nearest to the Vulan river mouth, is significantly higher than others as the concentration of the suspended matter is the highest here.
III. Estimation of water constituents concentration from absorption spectra
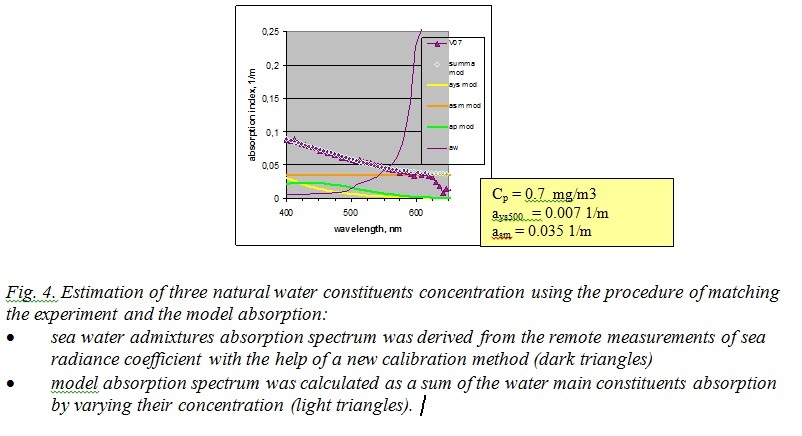
The next step was processing the absorption spectra in order to reveal the water content at every point. Assuming that the main water constituents for this region of the Black Sea are phytoplankton, “yellow substance” and suspended matter and using the model spectra for their absorption (we got them averaging the data from [5]) we calculated their concentrations. The phytoplankton absorption model has a bell shape with the maximum at pmax=440nm, the “yellow substance” absorption is modeled by the exponential function with the index g=-0.015nm-1 and both absorption and backscattering of the suspended matter do not depend on the wavelength. The illustration of this procedure is given in Fig. 4. After subtracting pure water absorption from the absorption spectrum obtained in the experiment we get the curve (dark triangles) representing the joint absorption spectrum of the water constituents. Varying the absorption values of the main water constituents we reach the best coincidence of the experimental and model total absorption curves and thus estimate the water constituents concentrations in terms
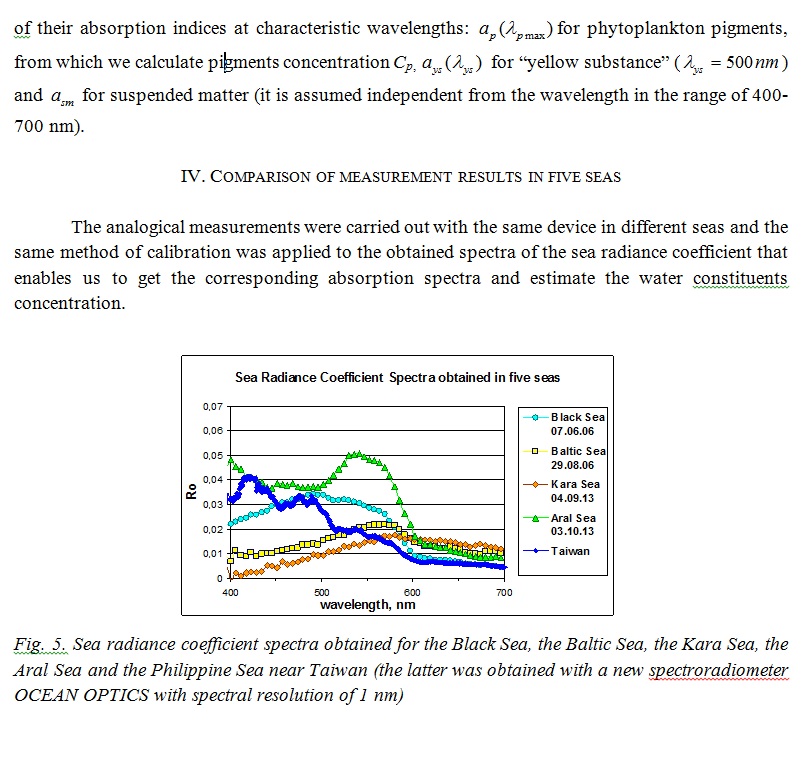
All measurements were carried out from board of moving vessels (Fig. 5). The weather during the experiments was typical for the season: wind and roughness of the sea were average intensity, the sky was overcast for the Baltic and the Kara Seas, cloudless for the Aral and Taiwan and rather changeable for the Black Sea. As a result of the measurements and further calculations we received the following absorption spectra (Fig. 6). One can see that water types are quite different for the regions of exploration and even under unfavorable weather conditions our new method shows its operability. Using the main water constituents specific absorption we then estimated their concentration (Table 1).
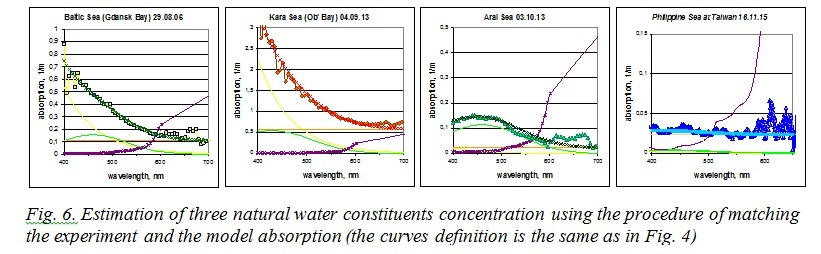
Table 1. Concentration of the main water constituents obtained by remote sensing
|
Concentration of |
Black Sea |
Baltic Sea |
Kara Sea |
Aral Sea |
Taiwan |
|
Suspended matter, 1/m |
0.04 |
0.1 |
0.57 |
0.02 |
0.02 |
|
“yellow substance” at 500nm, 1/m |
0.01 |
0.12 |
0.5 |
0.005 |
0.00 |
|
Phytoplankton pigments, mg/m3 |
0.7 |
4.5 |
15.6 |
3.3 |
0.1 |
V. Discussion of the results and conclusions
The suggested calibration method enables one to get sea radiance coefficient spectra and water absorption spectra of the aquatory under investigation for wide range of the weather and measurement conditions. This possibility was confirmed during the measurements at the river mouth in the Black Sea. Firstly, the application of this method to the obtained sea radiance coefficient spectra, which were rather chaotic due to the unfavorable weather conditions, allowed to estimate the water absorption spectra, which showed a gradual decrease of water absorption with increasing distance from the river mouth and the shore. It should be stressed that as this method is based on the inherent properties of the pure sea water it can be applied for aquatories with various content of sea water constituents. Secondly, the obtained absorption spectra were successfully processed to estimate concentration of the three natural sea water constituents – phytoplankton pigments, “yellow substance” and suspended matter, the obtained values being in quite satisfactory coincidence with the measurements of phytoplankton pigments concentration in water samples. There is a possibility to add some more impurities with their absorption spectra to this list if necessary.
Application of the suggested remote sensing method with new calibration to the five different seas is shown to be quite useful. It showed that one can get proper results in the cases with the sky totally overcast, in the cases with the low solar elevation angle in the Kara Sea and therefore with low level of signals, in the cases of great variety of the sea water constituents concentration. The obtained values of sea water constituents concentration, such as phytoplankton pigments, “yellow substance” and suspended matter, fall within the range of concentrations, measured by other methods in the aquatories under investigation (see [7], [5], [8], [9]).
On the whole, using the new calibration method we got some encouraging results:
• the distribution of the water absorption values, which were obtained by remote sensing, is quite reasonable for the Black Sea polygon (decreasing with the distance from the river mouth and from the shore)
• for the wide range of weather and measurements conditions as well as for the great variety of water constituents concentration the estimates of the concentration obtained by remote sensing get within the range of the estimates obtained from sampling for every region.
Estimating of natural water constituents concentration from data of optical passive remote sensing of sea surface from board a ship combined with the new calibration enables to get some necessary data during ground truth measurements or explore the sea areas which are too close to the coastal line or are unseen from satellites because of cloudiness.
The future research is planned for further validation of this method with relevant results of water content determination on water samples and for investigation of other coastal and inland seas.
Acknowlegement
This work has been supported by Russian Scientific Fund Project N 14-50-00095.
1. V. A. Matyushenko, V. N. Pelevin and V. V. Rostovtseva. “Measurement of the Sea Radiance Coefficient with Three-Channel Spectrophotometer from board a Research Ship”. Atmospheric and oceanic optics, vol. 9 (5): pp. 421-424. 1996.
2. C. D. Mobley, “Estimation of the Remote-Sensing Reflectance from above-Surface Measurements”. Applied Optics, vol. 38(36): pp. 7442-7455, 1999.
3. V. N. Pelevin, and V. V. Rostovtseva. “Estimation of “Yellow Substance” Concentration in Sea Water by Various Contact and Remote Measurements Data”. Proceedings of SPIE, vol. 4341: pp. 459-465, 2000
4. A. Hommersom, S. Kratzer, M. Laanen, I. Ansko, M. Ligi, M. Bresciani, C. Giardino et. al. “Intercomparison in the Field between the New WISP-3 and other Radiometers (TriOS Ramses, ASD FieldSpec, and TACCS)”. Journal of Applied Remote Sensing vol. 6: 063615-1 - 063615-21, 2012.
5. B. Wozniak, and J. Dera. Light Absorption in Sea Water. New York: Springer Science+Business Media, LLC, 2007.
6. V. V. Rostovtseva “Method for sea water absorption spectra estimation on the basis of shipboard passive remote sensing data and pure sea water properties”, Atmospheric and Oceanic Optics, vol. 29(2), pp.162-170, 2016.
7. N. A. Aibulatov, P. O. Zavyalov and V. V. Pelevin. “Peculiarities of Hydrophysical Self-Cleaning of Russian Black Sea Coastal Zone near the Mouths of Rivers”. [in Russian] Geoekologiya, no 4: pp. 301-310, 2008.
8. P. O. Zavyalov, ed. The Large Aral Sea at the Beginning of the 21th Century. Phisics, Biology, Chemistry. [in Russian]. Moscow: Nauka. 2012.
9. I. N. Sukhanova, M. V. Flint, S. A. Mosharov and V. M. Sergeeva. “Phytoplankton Community Structure and Primary Production in the Ob Estuary and Adjacent Kara Shelf”. Oceanology vol. 50(5): pp. 785-800. 2010.