


BISAC NAT010000 Ecology
BISAC NAT045050 Ecosystems & Habitats / Coastal Regions & Shorelines
BISAC NAT025000 Ecosystems & Habitats / Oceans & Seas
BISAC NAT045030 Ecosystems & Habitats / Polar Regions
BISAC SCI081000 Earth Sciences / Hydrology
BISAC SCI092000 Global Warming & Climate Change
BISAC SCI020000 Life Sciences / Ecology
BISAC SCI039000 Life Sciences / Marine Biology
BISAC SOC053000 Regional Studies
BISAC TEC060000 Marine & Naval
The distribution of dissolved chemical elements (major ions, nutrients, and trace elements) in the Yenisei River estuary and adjacent water area in 2009 and 2010 are presented. These results were compared to the data obtained during previous hydrochemical studies of this region. The transport of major cations (Na, K, Mg, Ca) and some trace elements (Rb, Cs, Sr, B, F, As, Mo, U) in the estuary follows conservative mixing. Alkalinity also belongs to conservative components, however this parameter exhibits substantial spatial heterogeneity caused by complex hydrological structure of the Yenisei Bay and adjoining part of the Kara Sea formed under the influence of several sources of desalination and salty waters inflow. Concentrations of Pmin, Si, and V in the desalinized waters of photic layer decrease seaward owing to uptake by phytoplankton. The losses of these elements reach 30–57, 30, and 9% of their supply by river runoff, respectively. The content of dissolved phosphates and vanadium in the intermediate and near-bottom layers of the Yenisei River estuary strongly increases with salinity due to regeneration of precipitated organic matter, whereas silica remineralization is much less pronounced. Barium is characterized by additional input of dissolved forms in the mixing zone in the quantity comparable to that carried out by river runoff. This may be caused by its desorption from river suspended matter due to ion exchange. The transport of dissolved Al and Mn in the estuarine zone is probably controlled by the coagulation and flocculation of organic and organomineral colloids, which is indicated by a decrease in the concentration of these elements at the beginning of the estuary (31 and 56%, respectively) followed by a stable concentration further seaward.
Yenisei River estuary, mixing zone between the riverine and seawater masses, dissolved chemical elements, conservative and nonconservative behavior.
I. Introduction
Regular complex researches of the Arctic ecosystems least susceptible to influence of anthropogenic environment variations are carried out within last decades. Basic direction of hydrochemical investigations is related with studying of continental runoff transformation during interaction with seawater.
Now considerable information has been accumulated on the solid matter transformation. The behavior of dissolved components, which are commonly subdivided into conservative and nonconservative, is much more poorly understood. The distribution of dissolved conservative components is fully controlled by the dynamic mixing of river water with seawater (in some rare cases, the contributions of groundwater, evaporation, and atmospheric precipitation should be accounted for). The distribution of dissolved nonconservative components depends also on the interreservoir physicochemical and (or) biological processes affecting the proportions of dissolved and suspended forms of chemical elements, as well as mass exchange at water–air and water–bottom interfaces.
The data about distribution of dissolved chemical elements (major ions, phosphates, silica, heavy metals and over trace elements) in mouth area of the Yenisei River which is most affluent river running into the Kara Sea are presented in this report.
II. Material and Methods
Sampling was conducted from August 29 till September 11, 2009 and on September 10–25, 2010 onboard the R/V “Sovetskaya Arctica”. The researches covered the Yenisei mouth area and adjoining Gydanskii Bay. Water samples were taken at 17 stations in 2009 from surface, intermediate, and near-bottom layers, and at 14 surface stations in 2010. Fig. 1 displays station locations except two most remote stations: I-1 (68°40¢N, 86°16¢E) and II-10 (76°10¢N, 75°15¢E).
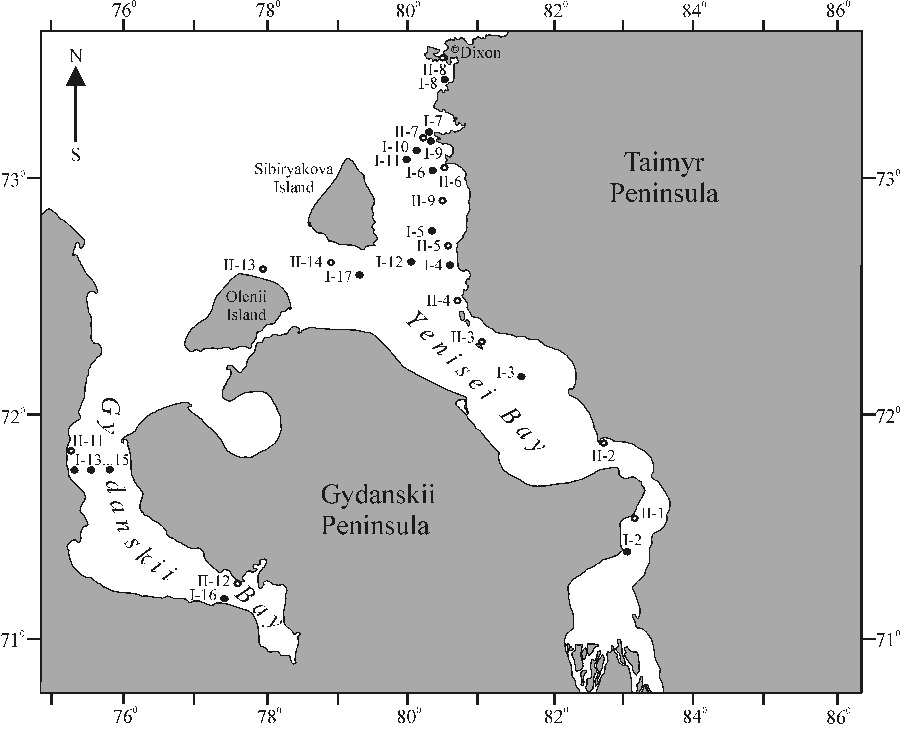
Fig. 1. Sampling locations in 2009 (I-no.) and 2010 (II-no.)
Water was sampled using a plastic bathometer, and the samples were immediately filtered and preserved. The samples were filtered through a small pore-size paper filter to analyze the major ions and fluorine. In order to determine the contents of nutrients, the solutions were filtered through a small pore-size paper filter into polyethylene flacks with subsequent addition of small amount of chloroform (1 ml per 100 ml of sample solution). For the analysis of trace elements, the water samples were filtered through a 0.45-μm membrane filter into polypropylene flasks containing aliquots of 5 N ultra-pure nitric acid (0.2 ml per 8 ml of sample solution). The analytic methods included volumetric titration (Cl, Alk), spectrophotometry (P, Si), ionometric analysis (F), and inductively coupled plasma mass spectrometry (Na, K, Mg, Ca, and trace elements). The relative error of measurements was no higher than ±3%.
III. Results and Discussion
Evaluation of the obtained results which are given in Tables 1 and 2 has allowed to establish that distribution of major cations (Na, K, Mg, Ca) and dissolved species of some studied trace elements (Rb, Cs, Sr, B, F, As, Mo, U) conforms to conservative type of behavior and is described by the linear equations between their concentrations and chloride content
.jpg)
There the parameter a approaches the element i concentration in river waters in mg/l, b is the slope, and r is the correlation coefficient. The numerical values of parameters a and b for these elements resulted in Table 3 are close to those established in the previous researches for calcium, strontium, boron, and fluorine [1].
Table 1. Chlorinity, alkalinity and concentrations of dissolved phosphates, silica, and fluorine in the Yenisei River estuary and adjacent water area in 2009–2010
|
Station no. |
Horizon, m |
Cl, mg/l |
Alk, meq/l |
Pmin, μg/l |
Si, mg/l |
F, mg/l |
|
2009 |
||||||
|
I-1 |
0.2 |
12.1 |
1.25 |
12.7 |
2.38 |
0.19 |
|
I-2 |
0.2 |
23.8 |
0.34 |
20.4 |
2.31 |
0.12 |
|
I-3 |
0.2 |
596 |
0.88 |
12.4 |
2.02 |
0.15 |
|
“ |
27.0 |
15700 |
1.25 |
28.1 |
1.12 |
1.05 |
|
I-4 |
0.2 |
2050 |
0.85 |
14.4 |
1.65 |
0.19 |
|
“ |
10.0 |
2160 |
0.80 |
12.8 |
1.56 |
0.21 |
|
I-5 |
0.2 |
2460 |
0.99 |
11.0 |
1.50 |
0.22 |
|
“ |
10.0 |
3710 |
1.07 |
11.4 |
1.33 |
0.29 |
|
I-6 |
0.2 |
2070 |
0.78 |
9.4 |
1.50 |
0.20 |
|
I-7 |
0.2 |
2670 |
0.81 |
9.6 |
1.36 |
0.23 |
|
“ |
10.0 |
11370 |
1.43 |
23.9 |
1.08 |
0.80 |
|
I-8 |
0.2 |
3910 |
0.25 |
14.5 |
1.23 |
0.29 |
|
“ |
10.0 |
10550 |
1.71 |
15.5 |
0.97 |
0.74 |
|
“ |
24.0 |
17970 |
2.33 |
8.1 |
0.69 |
1.24 |
|
I-9 |
0.2 |
2350 |
0.72 |
15.4 |
1.52 |
0.22 |
|
“ |
10.0 |
3160 |
1.06 |
9.8 |
1.50 |
0.25 |
|
“ |
22.0 |
17310 |
2.32 |
33.3 |
0.71 |
1.18 |
|
I-10 |
0.2 |
2490 |
0.73 |
14.4 |
1.47 |
0.21 |
|
“ |
10.0 |
7050 |
0.93 |
10.5 |
1.24 |
0.52 |
|
I-11 |
0.2 |
2350 |
0.91 |
9.5 |
1.50 |
0.22 |
|
“ |
10.0 |
5610 |
0.62 |
11.0 |
1.28 |
0.42 |
|
I-12 |
0.2 |
3840 |
1.09 |
10.0 |
1.42 |
0.30 |
|
“ |
16.0 |
16840 |
2.28 |
31.6 |
0.76 |
1.16 |
|
I-13 |
0.2 |
3520 |
0.74 |
6.7 |
0.40 |
0.27 |
|
I-14 |
0.2 |
4050 |
0.53 |
7.3 |
0.50 |
0.30 |
|
I-15 |
0.2 |
4500 |
1.07 |
6.2 |
0.73 |
0.30 |
|
I-16 |
0.2 |
173 |
0.33 |
12.9 |
0.17 |
0.06 |
|
I-17 |
0.2 |
5860 |
1.11 |
10.5 |
1.24 |
0.44 |
|
“ |
10.0 |
6700 |
1.32 |
10.2 |
1.19 |
0.49 |
|
2010 |
||||||
|
II-1 |
0.2 |
11.1 |
1.09 |
7.1 |
2.46 |
0.13 |
|
II-2 |
0.2 |
18.4 |
1.12 |
2.7 |
2.18 |
0.14 |
|
II-3 |
0.2 |
459 |
1.11 |
1.5 |
– |
0.11 |
|
II-4 |
0.2 |
559 |
1.12 |
3.2 |
2.25 |
0.11 |
|
II-5 |
0.2 |
375 |
1.10 |
2.9 |
2.12 |
0.11 |
|
II-6 |
0.2 |
4350 |
1.20 |
1.9 |
– |
0.35 |
|
II-7 |
0.2 |
6740 |
1.40 |
1.8 |
– |
0.50 |
|
II-8 |
0.2 |
9570 |
1.61 |
1.5 |
– |
0.66 |
|
II-9 |
0.2 |
1930 |
1.12 |
– |
1.75 |
0.20 |
|
II-10 |
0.2 |
3350 |
1.09 |
– |
1.61 |
0.28 |
|
II-11 |
0.2 |
4940 |
1.39 |
1.9 |
1.42 |
0.39 |
|
II-12 |
0.2 |
142 |
0.26 |
8.9 |
1.83 |
0.11 |
|
II-13 |
0.2 |
3310 |
1.12 |
1.9 |
1.23 |
0.29 |
|
II-14 |
0.2 |
881 |
1.11 |
2.0 |
– |
0.14 |
Table 2. Concentrations of dissolved trace elements in the Yenisei River estuary and adjacent water area in 2009
|
Station no. |
Hori-zon, m |
Rb |
Cs |
Sr |
Ba |
B |
Al |
Mn |
V |
As |
Mo |
U |
|
μg/l |
mg/l |
μg/l |
mg/l |
μg/l |
||||||||
|
I-1 |
0.2 |
0.70 |
0.008 |
0.22 |
4.39 |
0.011 |
16.0 |
7.78 |
0.98 |
0.39 |
0.61 |
0.31 |
|
I-2 |
0.2 |
0.59 |
0.003 |
0.20 |
5.22 |
0.011 |
14.7 |
4.30 |
1.04 |
0.44 |
0.61 |
0.29 |
|
I-3 |
0.2 |
3.87 |
0.064 |
0.38 |
5.87 |
0.13 |
12.7 |
2.95 |
1.10 |
0.41 |
0.76 |
0.23 |
|
“ |
27.0 |
94.8 |
2.67 |
6.39 |
11.7 |
3.50 |
5.6 |
1.65 |
0.96 |
1.35 |
8.57 |
2.46 |
|
I-4 |
0.2 |
12.7 |
0.50 |
0.99 |
7.75 |
0.47 |
14.4 |
4.91 |
0.94 |
0.43 |
1.27 |
0.38 |
|
“ |
10.0 |
13.2 |
0.52 |
0.98 |
7.23 |
0.50 |
8.04 |
1.73 |
0.97 |
0.44 |
1.33 |
0.40 |
|
I-5 |
0.2 |
17.3 |
0.62 |
1.10 |
7.55 |
0.57 |
11.3 |
3.88 |
0.96 |
0.55 |
1.79 |
0.48 |
|
“ |
10.0 |
23.4 |
1.11 |
1.56 |
7.93 |
0.85 |
8.35 |
1.40 |
0.86 |
0.66 |
2.35 |
0.66 |
|
I-6 |
0.2 |
13.3 |
0.58 |
0.92 |
6.96 |
0.48 |
10.2 |
2.43 |
0.81 |
0.50 |
1.36 |
0.37 |
|
I-7 |
0.2 |
16.6 |
0.66 |
1.15 |
7.24 |
0.62 |
8.41 |
1.96 |
0.87 |
0.56 |
1.61 |
0.47 |
|
“ |
10.0 |
68.4 |
2.12 |
4.71 |
12.4 |
2.58 |
4.59 |
1.93 |
1.04 |
0.92 |
5.93 |
1.87 |
|
I-8 |
0.2 |
23.3 |
0.72 |
1.67 |
8.27 |
0.89 |
7.76 |
1.88 |
0.77 |
0.46 |
2.28 |
0.66 |
|
“ |
10.0 |
63.7 |
1.60 |
4.43 |
10.7 |
2.43 |
5.80 |
2.13 |
0.81 |
0.99 |
5.70 |
1.72 |
|
“ |
24.0 |
109 |
2.45 |
7.32 |
8.05 |
4.04 |
4.27 |
1.67 |
1.22 |
1.69 |
9.25 |
2.71 |
|
I-9 |
0.2 |
14.2 |
0.27 |
1.06 |
8.03 |
0.54 |
12.3 |
1.52 |
0.91 |
0.42 |
1.87 |
0.44 |
|
“ |
10.0 |
19.4 |
0.42 |
1.42 |
8.36 |
0.75 |
9.04 |
1.65 |
0.91 |
0.50 |
2.01 |
0.55 |
|
“ |
22.0 |
105 |
2.25 |
7.13 |
9.22 |
3.91 |
5.45 |
1.52 |
1.26 |
1.58 |
8.98 |
2.68 |
|
I-10 |
0.2 |
16.1 |
0.54 |
1.10 |
7.55 |
0.58 |
9.71 |
4.24 |
0.88 |
0.52 |
1.77 |
0.47 |
|
“ |
10.0 |
43.9 |
1.39 |
2.97 |
10.8 |
1.63 |
10.3 |
2.78 |
0.88 |
0.95 |
4.21 |
1.21 |
|
I-11 |
0.2 |
14.6 |
0.34 |
1.04 |
7.58 |
0.54 |
8.65 |
1.65 |
0.90 |
0.49 |
1.46 |
0.44 |
|
“ |
10.0 |
33.4 |
0.70 |
2.32 |
9.87 |
1.28 |
8.59 |
1.87 |
0.78 |
0.70 |
2.94 |
0.95 |
|
I-12 |
16.0 |
102 |
2.10 |
6.94 |
10.0 |
3.85 |
4.23 |
1.37 |
1.15 |
1.46 |
8.21 |
2.63 |
|
I-13 |
0.2 |
20.9 |
0.23 |
1.47 |
6.31 |
0.82 |
14.1 |
2.73 |
0.77 |
0.45 |
2.27 |
0.62 |
|
I-14 |
0.2 |
23.1 |
0.32 |
1.66 |
6.35 |
0.93 |
12.6 |
2.12 |
0.88 |
0.61 |
2.19 |
0.68 |
|
I-15 |
0.2 |
29.3 |
0.53 |
1.84 |
7.74 |
0.99 |
12.5 |
2.74 |
0.91 |
0.83 |
2.88 |
0.72 |
|
I-16 |
0.2 |
1.57 |
0.036 |
0.07 |
2.54 |
0.045 |
19.7 |
3.38 |
0.90 |
0.35 |
0.31 |
0.09 |
|
I-17 |
0.2 |
35.2 |
0.99 |
2.43 |
9.26 |
1.31 |
12.1 |
1.22 |
0.84 |
0.92 |
3.63 |
0.95 |
|
“ |
10.0 |
40.8 |
1.13 |
2.84 |
10.0 |
1.55 |
10.5 |
2.24 |
0.76 |
0.99 |
4.04 |
1.11 |
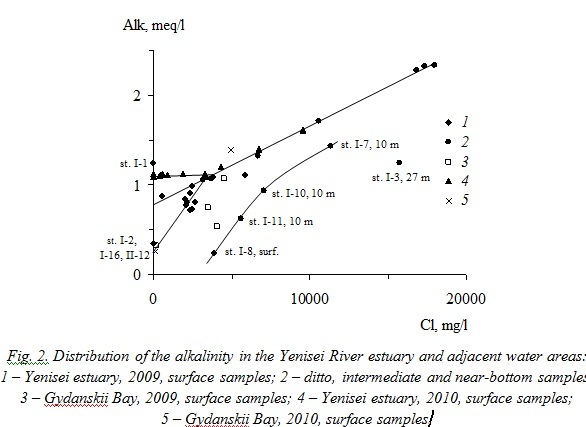
Alkalinity in mouth area of the Yenisei River also belongs to conservative components. However this parameter differs spatial heterogeneity caused by complex hydrological structure of the Yenisei Bay and adjoining part of the Kara Sea formed under influence of several sources of desalination and salty waters inflow [2, 3, etc.]. Fig. 2 shown that most part of the water samples from intermediate and near-bottom layers, as well as partially from surface layer, form the general linear relationship between alkalinity value and chloride content for 2009 and 2010:

Boundary values for this relationship are Alk = 0.77 meq/l in the river water and 2.35 meq/l at chlorinity of 18 g/l. The first value almost precisely coincides with assessment of Alk-0 for near-mouth part of the Kara Sea (0.73 meq/l [2]), the last value coincides with characteristic of seawater mass (2.32 meq/l [3]). At the same time the main part of desalinated surface samples forms separate relationships: with the lowered alkalinity in 2009 (except for station I-1)
.jpg)
and with the raised alkalinity in 2010
[Alk] = const = 1.11 meq/l. (4)
These relationships converge with the basic equation (2) in one point at chlorides content of 3.3 g/l and alkalinity of 1.1 meq/l. The lowered alkalinity also is peculiar to desalinated waters of the Gydanskii Bay. One more lens of waters with lower alkalinity is obtained in 2009 near the Taimyr Peninsula coast to the north of the Sibiryakova Island (intermediate layer of stations I-11, I-10, I-7, and surface layer of station I-8), as well as the local minimum of alkalinity is observed in near-bottom horizon of station I-3 in central part of the Yenisei Bay.
Table 3. Distribution of dissolved chemical elements in the Yenisei River estuary and adjacent water area
|
Element i |
Years of observation* |
Behavior |
Parameters of Equation (1) |
Number of samples (n) |
||
|
a |
b |
r |
||||
|
Major cations |
||||||
|
Na |
2009 |
Cons. |
10.9 |
0.552 |
0.999 |
28 |
|
K |
Same |
Cons. |
1.08 |
0.0203 |
0.999 |
28 |
|
Mg |
“ |
Cons. |
3.87 |
0.0665 |
0.999 |
28 |
|
Ca |
1993 |
Cons. |
19.4 |
0.0202 |
0.993 |
22 |
|
|
2009 |
|
9.26 |
0.0206 |
0.999 |
28 |
|
Biogenic and biologically active elements |
||||||
|
Pmin |
2009–2010 |
Noncons. |
Loss, maximum 30–57% at [Cl] = 1.0–2.5 g/l |
41 |
||
|
Si |
Same |
Noncons. |
Loss, maximum 30% at [Cl] = 2.0–3.0 g/l |
38 |
||
|
V |
2009 |
Noncons. |
Loss, maximum 9% at [Cl] = 3.0–3.5 g/l |
28 |
||
|
Trace elements |
||||||
|
Rb |
2009 |
Cons. |
5.0´10–4 |
6.02´10–6 |
0.999 |
28 |
|
Cs |
Same |
Cons. |
1.1´10–4 |
1.38´10–7 |
0.956 |
28 |
|
Sr |
1993 |
Cons. |
0.14 |
3.84´10–4 |
0.995 |
22 |
|
|
2009 |
|
0.10 |
4.03´10–4 |
0.999 |
28 |
|
Ba |
2009 |
Noncons. |
Gain, maximum 100% at [Cl] = 10–13 g/l |
28 |
||
|
B |
1993 |
Cons. |
0.082 |
1.95´10–4 |
0.989 |
18 |
|
|
2009 |
|
0.013 |
2.26´10–4 |
0.999 |
28 |
|
F |
1993 |
Cons. |
0.010 |
6.68´10–5 |
0.977 |
22 |
|
|
2009–2010 |
|
0.079 |
6.25´10–5 |
0.996 |
43 |
|
Al |
2009 |
Noncons. |
Loss, maximum 31% at [Cl] = 3.0–4.0 g/l |
28 |
||
|
Mn |
Same |
Noncons. |
Loss, maximum 56% at [Cl] = 2.5–4.0 g/l |
28 |
||
|
As |
“ |
Cons. |
3.5´10–4 |
6.81´10–8 |
0.967 |
28 |
|
Mo |
“ |
Cons. |
4.7´10–4 |
4.90´10–7 |
0.997 |
28 |
|
U |
“ |
Cons. |
1.2´10–4 |
1.47´10–7 |
0.997 |
28 |
* Results of measurements conducted in 1993 were published in [1].
The nonconservative behavior in the Yenisei River estuary is established for phosphates (Pmin), silica, vanadium, barium, aluminum, and manganese (Figs. 3, 4). The maximum values of additional input (removal) of nonconservative elements in the mixing zone between the riverine and seawater masses are given in Table 3.
Decrease in dissolved phosphates concentration with the increase of chloride content, caused, apparently, by biological assimilation, was observed in the surface desalinized layer during both surveys (Fig. 3). Concentration of Pmin at river edge of the mixing zone was approximately two times less in 2010 (0.007–0.009 mg/l) than in 2009 (0.013–0.020 mg/l) that resulted at nearly complete removal of dissolved phosphates when chloride content exceeded 0.5 g/l. Similar variations of phosphates distribution in the surface layer at decrease in their concentration with salinity increase were revealed also during previous hydrochemical researches of the Yenisei River estuary at summer–autumn low-water period of 1993, 1999, 2003, and 2007 [4, 5].
Concentrations of dissolved phosphates in the intermediate (10 m) and near-bottom layers of the Yenisei River estuary in 2009 increased essentially with salinity increment up to 0.033 mg/l that two times as much as the average Pmin concentration at river edge of the mixing zone. The same regularity was established also in 1993, 1999, 2003, and 2007 [4, 5] and occurs due to regeneration of precipitated organic matter. Deviations of dissolved phosphates concentration in two samples of the near-bottom water at stations I-7 and I-8, possibly, were induced by local features of exchange processes at the water–bottom boundary.
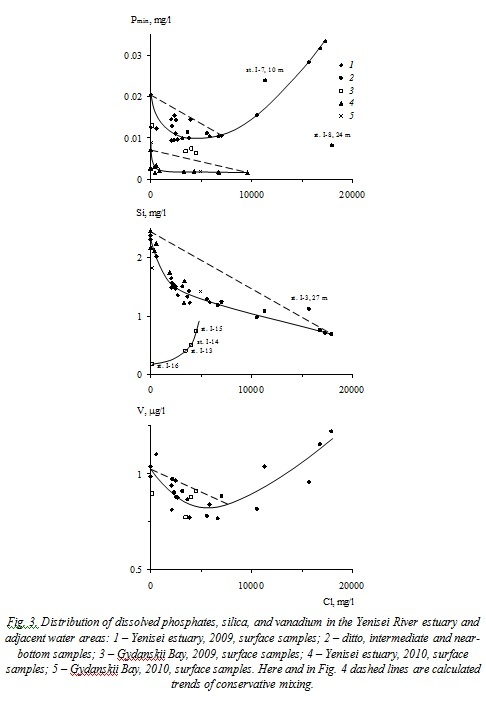
Decrease of dissolved silica concentration in the Yenisei River estuary with the increase in chloride content is described by the common relationship for 2009 and 2010 consisting of two linear sections different by values of dSi/dCl gradient: –3´10‑4 for initial stages of river- and seawater mixing, but –5´10‑5 for chloride concentration >2.5 g/l (Fig. 3). The higher value of dSi/dCl gradient in desalinized waters of the photic layer seems to result from silica consumption by diatoms. Production of organic matter stops in the deeper water layers, and silica remineralization proceeds less intensively than phosphates. Sample from station I-3 have essentially higher silica concentration due to its diffusion from the bottom sediments. Samples from stations I-13–I-16 (the Gydanskii Bay, 2009) have lower silica content and the specific regularity, although in 2010 silica concentrations for this area are close to the same in the Yenisei River estuary. Dramatic variability in dissolved silica year-to-year distribution was noted in [6], where it was designated that silica concentration decreased during river- and seawater mixing in the Yenisei Bay in 1993 and 2001, but the increase of silica content in waters with salinity <10‰ was observed in 1999.
Distribution of vanadium is similar to distribution of phosphates: its concentration decreases in the photic layer and increases in the intermediate and near-bottom layers to the values exceeding its average content at river edge of the mixing zone (Fig. 3). Vanadium is biologically active chemical element. Therefore the most probable cause for such nonconservative behavior may be biological assimilation in zone of intensive organic matter production and input into solution in the deeper water layers as a result of organic matter remineralization that was shown also in [6].
Thus, the distinctive feature of phosphates, silica, and vanadium migration in the Yenisei River estuary is nonconservative behavior, caused by their participation in production–destruction processes. The losses of these elements reached 30–57, 30, and 9% of their supply by river runoff at chloride content of 1.0–2.5, 2.0–3.0, and 3.0–3.5 g/l, respectively.
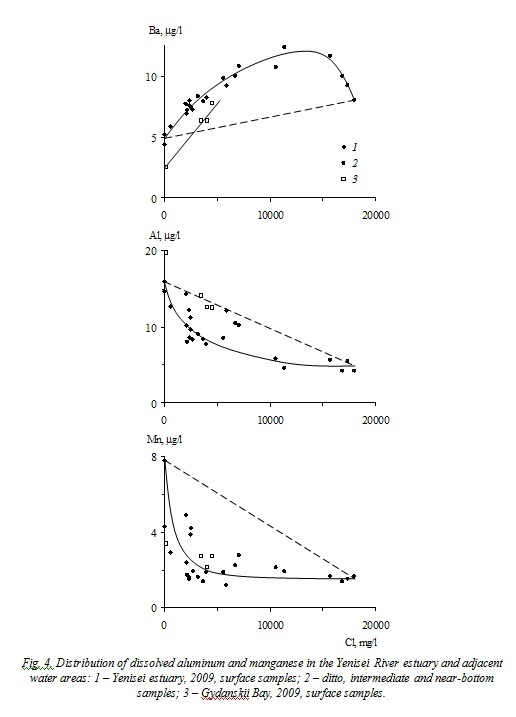
Migration of barium, aluminum, and manganese in the Yenisei River estuary (Fig. 3) occurs under the influence of chemical processes. Barium is characterized by additional input of dissolved forms all through the riverine and seawater masses mixing zone in the quantity comparable to its carrying out by river runoff owing to ion exchange reactions in the absorbed complex of river suspended matter. The distribution of dissolved species of aluminum and manganese in the estuarine zone is probably controlled by the coagulation and flocculation of organic and organomineral colloids, which is indicated by decrease in the content of these elements at the initial stage of salinization (31 and 56%, respectively) followed by a plateau. The similar behavior of these elements was observed also in the mouths of most rivers around the world [6].
IV. Conclusions
A field study of the Yenisei River estuary and adjacent water area in 2009–2010 demonstrated conservative behavior of major cations, alkalinity, and dissolved forms of some trace elements (Rb, Cs, Sr, B, F, As, Mo, U). The behavior of Pmin, Si, V, Ba, Al, and Mn is nonconservative and presumably linked to their uptake by biota / release from organic detritus (P, Si, V), desorption from river suspended matter (Ba), and colloidal coagulation (Al, Mn). Overall, the general features of element transport across the Kara Sea estuaries are similar to those reported for other subarctic and temperate rivers of the world.
 .
.
V. Acknowledgments
This study was financially supported by the Russian Foundation for Basic Research, project no. 16-05-00369. Partial support from projects BIO-GEO-CLIM no. 14.B25.31.001 and FANO no. 0410-2014-0030 is also acknowledged.
1. A.V. Savenko, Geochemistry of Strontium, Fluorine, and Boron in the River-Sea Water Mixing Zone. Moscow: GEOS, 2003.
2. P.A. Stunzhas, “Differentiation of Ob and Yenisei waters in the Kara Sea by alkalinity and silikate”, Oceanology, vol. 35, pp. 197-202, March 1995.
3. P.N. Makkaveev, P.A. Stunzhas, and P.V. Khlebopashev, “The distinguishing of the Ob and Yenisei waters in the desalinated lenses of the Kara Sea in 1993 and 2007”, Oceanology, vol. 50, pp. 698-705, October 2010.
4. V.V. Gordeev, B. Beeskow, and V. Rachold, “Geochemistry of the Ob and Yenisey estuaries: A comparative study”, Berichte zur Polar- und Meeresforschung, vol. 565, 2007.
5. P.N. Makkaveev, P.A. Stunzhas, Z.G. Mel’nikova, P.V. Khlebopashev, and Sh.Kh. Yakubov, “Hydrochemical characteristics of the waters in the western part of the Kara Sea”, Oceanology, vol. 50, pp. 688-697, October 2010.
6. V.V. Gordeev, Geochemistry of the River-Sea System. Moscow, 2012.