


BISAC NAT010000 Ecology
BISAC NAT045050 Ecosystems & Habitats / Coastal Regions & Shorelines
BISAC NAT025000 Ecosystems & Habitats / Oceans & Seas
BISAC NAT045030 Ecosystems & Habitats / Polar Regions
BISAC SCI081000 Earth Sciences / Hydrology
BISAC SCI092000 Global Warming & Climate Change
BISAC SCI020000 Life Sciences / Ecology
BISAC SCI039000 Life Sciences / Marine Biology
BISAC SOC053000 Regional Studies
BISAC TEC060000 Marine & Naval
Russian priority - the study of storm surges and wave climate in the Arctic seas due to the active development of offshore oil and gas. Researching the formation of storm surge and wave are necessary for the design and construction of facilities in the coastal zone, as well as for the safety of navigation. An inactive port ensues considerable economic losses. It is important to study the variability of storm surges, wave climate in the past and forecast the future. Consequently, this information would be used for planning the development of the Arctic in accordance with the development programme 2020. Mathematical modeling is used to analyze the characteristics of storm surges and wave climate formation from 1979 to 2010 in the White and Barents Seas. Calculation of storm surge heights in the seas is performed using model AdCirc on an unstructured grid with a 20 km pitch in the Barents Sea and 100 m in the White Sea. The model AdCirc used data of wind field reanalysis CFSv2. The simulation of storm surge was conducted with/without pressure, sea state, tides. A non-linear interaction of the surge and tide during the phase of destruction storm surge was detected. Calculation of the wave climate performed using SWAN spectral wave model on unstructured grids. Spatial resolution is 500 m-5 km for the White Sea and 10-20 km for the Barents Sea. NCEP/CFSR (~0.3°) input wind forcing was used. The storminess of the White Sea tends to increase from 1979 to 1991, and then decrease to minimum at 2000 and increase again till 2010.
Arctic, storm surge, wave climate, ADCIRC, SWAN
I. INTRODUCTION
Currently, there are virtually no scientific studies on the features of the spatio-temporal variability of storm surges and wind waves of the White Sea. Some aspects of storm surges and wind waves of the White Sea were touched upon only in a few works published quite a long time ago [1, 2, 3, 5,6,12, 14].
II. Materials and research methods
A new method of calculating wind fluttering of the White Sea is proposed. Unstructured settlement area, which covers the entire area of the Barents and White Seas, was built to avoid the boundary conditions on the open boundary of the computational grid and to reduce the computational cost by using the method of nested grids (Fig. 1, left). Using the unstructured grid with a pitch of 20 km in the Barents Sea and up to 500 m in the White helped to keep the small features of the coastline of the White Sea, small islands and shallow banks and helped to assess their impact on the development and transformation of wind-generated waves. It has to be noted that this area was based on the guidelines of the work [9]. In this paper, we present the evaluation of the effect of the swell generated either in the North Atlantic or in the Barents Sea, on the waters of the White Sea. It turned out that the effect on the White Sea from the North Atlantic swell slightly (height up to 0.2 m) for the area.
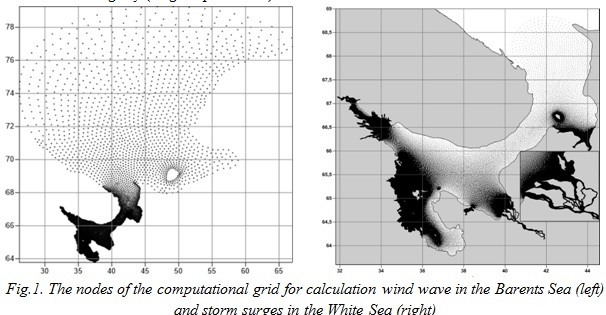
Other unstructured triangulation grid for the dynamic system has been created to simulate the storm surge with a system Surface Modeling System (SMS 11) Aquaveo for the White Sea - mouth area (Fig. 1, right) [10]. The grid was created by «paving», i.e. grid construction is based on the number of points on the shoreline [11]. Spacing on the coast in areas of the Gorlo (Fig.2) and the Onega Bay is 3 km away, Voronka - 5 km, on the whole west coast skerries - 150 m, punctuated by a rectilinear portions in increments of 200 m; in Mezenskaya Bay - 150 m, in the Dvina Bay, Delta, mouth area and on the site of the Northern Dvina estuary to the village of Ust-Pinega - 50 m; for the rest of the islands - 75 m (exception: Bolshoy Solovetsky Island, The Velikiy and Morzhovets - 100 m). Thus, the calculated unstructured grid with a minimum resolution of 50 m and a maximum of 5 km was constructed. However, for the second case - storm surge modeling, the calculated mesh has two outer liquid boundaries: at the entrance to Voronka of the White Sea and the Northern Dvina River near the mouth of the Pinega River. At the entrance to Voronka of the White Sea tidal fluctuations of sea level were specified in increments of 1 hour for a period of surge, calculated from the harmonic constant with hydrometeorological station Guba Saviha (39° 7.00 'E, 68° 11.00' N) and Tarkhanovo (43° 39.00 'E, 68° 30.00 'N). At 100 km from the mouth of the Northern Dvina (mouth of the river Pinega) the average river flow (data taken from gauging the village of Ust-Pinega) was indicated.
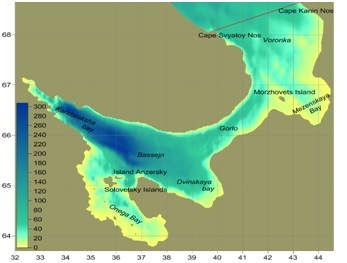
Fig.2 Bathymetry of the White Sea
The spectral wind-wave model SWAN 41.01 third generation was used to calculate the excitement. It is one of the most modern models existing that allows to make calculations of parameters of wind waves in the coastal zone for specified fields of wind and currents, topography of the seabed [13]. This model is being developed and freely distributed by Delft University of Technology. SWAN model is not inferior to the quality of the calculations in deep water on the seas [4] compared to other models (WAM and WATCH III), SWAN can estimate the waves in shallow water, which is especially important for the White Sea. The following characteristics of waves were calculated: height of significant waves (corresponding to 13% probability), the direction, the average period length and the wave height of the swell, the transfer of wave energy. Parameters of the mechanisms that were used in the model were set by default.
Barotropic model ADvanced CIRCulation model for oceanic, coastal and estuarine waters (ADCIRC) was selected to calculate the storm surge in the mouth area of the Northern Dvina River. This model is being developed at the University of North Carolina (USA). The model has a time-dependency, is non-linear, on the f-plane, takes into account wind pressure, atmospheric pressure, tides, rivers influence. The properties of the underlying surface can be defined in the model. It works with an unstructured computational grid that is needed for the seas with a complex configuration of the shoreline. In addition, it takes into account the flooding and drainage of adjacent land. This is the only licensed model to calculate the storm surge in the United States. It can be used in conjunction with a spectral wave model SWAN for the account of the wave surge, which is absent in all other models.
As input wind fields for numerical calculations high-resolution data reanalysis NCEP/CFSR (Climate Forecast System Reanalysis) for the period from 1979 to 2010 was used. This reanalysis is selected for the reason that it has a high spatial (~ 0.3°) and temporal resolution (1 hour), and a comparison of data on wind speed and direction reanalysis CFSR, MErra, JRA, Era Interim data of weather stations in the Arctic basin showed that the reanalysis CFSR has minimal error and a good correlation with the observed data [7].
As input data on topography and configuration of the coastline of the White Sea and Barents Sea open maps of the General Staff and GosGisTsentr of different scales depending on the study area were digitized. Due to the presence of sea ice analysis of wind waves was conducted only during the ice-free season (May to December).
III. wave climate Results and discussion
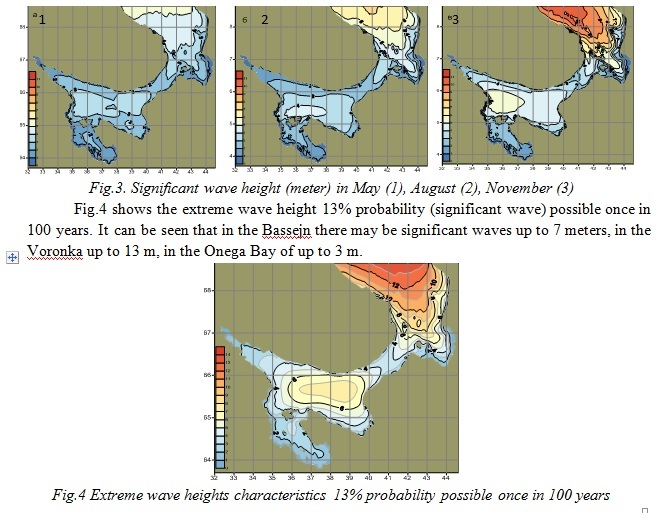
From Fig. 3 it can be defined there exist two areas where the highest waves are formed throughout the year in the White Sea. These are the areas Bassejn and Voronka. In these areas, there is an increased intensity of emotion from spring to autumn. For example, in May in the Bassejn wave height 13% of the supply reaches 3.5 m in November — already 5.5 m. In Voronka in May wave height is about 5.5 m, in November - 10.5 m. In the first case the intense development of the waves is due to the presence of relatively large distances to disperse the wind, in the second area the presence of large wave heights is due to their spread from the Barents Sea.
The Gorlo plays a special role. This strait is a barrier on the way of spreading of high waves from a Voronka as well as from the Bassejn. For example, in November to the northern part of the Gorlo waves of heights of 5 m come from the Voronka. Wave height is slightly lower - up to 4 m coming into the southern part of the Strait from Bassejn. However, in the Strait wave heights are reduced to 3 m and, interestingly, these tongues of high waves spreading from different sources do not reach each other.
Onega Bay spatial structure of heavy sea is due to its large reserve, the presence of the Solovetsky Islands at the entrance to the bay. However, spreading of the high waves of the Bassejn through the Strait East Solovetsky Salma was observed despite the isolation. Wave height of 13% probability in the Gulf does not exceed 2.5 m.
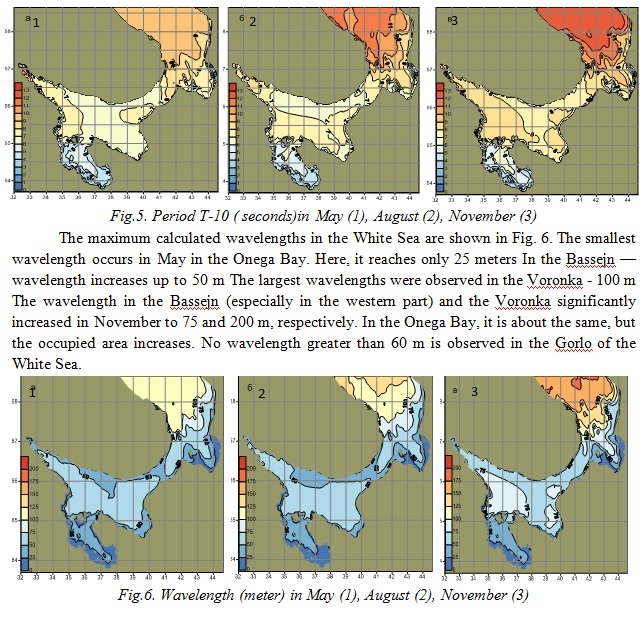
The maximum calculated average periods of T-10 waves are shown in Fig. 5. It can be seen that in May the average wave period in the Onega Bay reaches 5 seconds, Bassejn 6-7 seconds, in the Voronka — 9 seconds. By November, the average wave period in the White Sea is greatly increasing, especially in the Voronka. Thus, the average period of the waves in the Onega Bay is of approximately 6 seconds, 8 seconds in the Bassejn, and in the Voronka for 12 seconds.
The spatial distribution of swell height in the White Sea is very interesting (Fig. 7). In May, in the Onega Bay, Bassejn and Gorlo swell height does not exceed 1 m. Only in the Voronka, it increases up to 3 meters. By November, the height of the swell increases up to 3 m in the western part of the Bassejn and up to 9 m in the Voronka. In the central part of the Gorlo, it remains the same, indicating the inability of swell transit through the Gorlo into the White Sea. It also can be noted that Mezenskaya Bay, despite the presence shallow banks on the north and Islands Morzhovets, is still under the influence of wave processes, formed in the Barents Sea.
Temporal variability of wind waves in the White Sea was calculated to study the number of synoptic situations with different wave heights (more than 2, 3, 4 and 5 m) in the Bassejn and the Voronka (Fig. 8).

The number of synoptic situations of wave height of more than 2 m (50-60 events) in the Voronka is about 3 times more than in the Bassejn, of heights of more than 3 m (25-40 events) already5-6 times more. Cases with wave heights greater than 5 m in the the Bassejn are rarelynoted, while in the Voronka they occur 10 times a year.
Temporal variability of the number of synoptic situations clearly stands out in the Voronka of the White Sea. In the decade, 1979-1989 there is an increase in weather patterns. In 1992-1994 is the maximum of such cases. Then their sharp decrease until 2000. Then a gradual increase until 2010. A similar picture is observed in the Bassejn.
On average over the period from 1979 to 2010, trends to increase or decrease the amount of storm situations were not noted.
In conclusion, the wave climate of the White Sea is characterized by increased storm activity in autumn and winter months, a significant spatial and temporal heterogeneity of the properties of wind wave fields, the determined areas with different wave mode: Onega Bay, Bassejn, Gorlo, and Voronka.
IV. storm surge Results and discussion
Storm Surges in the White Sea are mainly caused by the release of deep cyclones of two types - "diving" (repeatability about 88%) and Atlantic. "Diving" cyclone - an extratropical cyclone, characterized by a special path, for example, from north to south, and high travel speeds. Such cyclones move from the Barents Sea through Finland into the central western area of the county to the lower Don, from Cape Kanin Nos through Kirov to Tatarstan and then to the lower fieldsof the Ural River.
Due to the tidal character of the White Sea preliminary numerical calculations of tids were made using ADCIRC model. Te comparison of numerical calculations with field measurements of sea level of Solombala showed that systematic error was about 10% (Fig. 9). Points shown in Fig. 10 were chosen for analysis of storm surge.
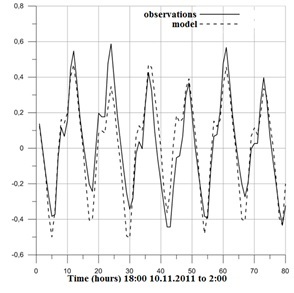
Fig.9. Comparison of the calculated and observed sea level (m) Solombala (point №8, Fig. 10)
Let’s consider the use of mathematical modeling techniques to study the characteristics of the formation of storm surges in the dynamic system of the White Sea - mouth area of the Northern Dvina River on the example of storm surge in November 15, 2011. This storm surge was of the largest height level, flooding area and duration of standing.
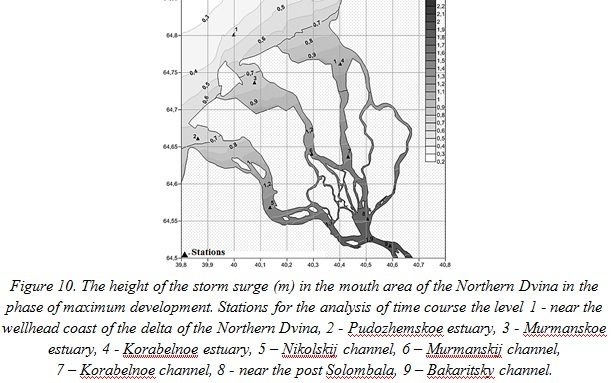
Fig. 10 shows the spatial distribution of the height of the storm surge in the mouth area of the Northern Dvina in the phase of maximum development. The height is calculated as the difference between the height of the level obtained by the models and precomputed level tide (tide level fluctuations are excluded). Fig. 10 shows that storm surge extends from the north-north-west of the Dvina Bay. This causes a difference in height of storm surge as it enters the channels of the river delta. Thus, in Korabel’nom estuary surge height is 0.8 m, and in the mouth Pudozhemskom – 0.6 m. As the storm surge moves from seaside wellhead to the mouth of the Northern Dvina (district Solombala) its height increases from 0.5 to 2 m.
Features of water circulation (tidal currents are excluded) in the Dvina Bay in the mouth area of the Northern Dvina in the different phases of the storm surge are shown in Fig. 11, 12. In the phase of maximum speed raising of sea level (up to 8 hours maximum) the flow of water in all the channels is directed to the river mouth, and in the structure of the flows in the channels there are significant differences in flow velocity, and the spatial distribution (Fig. 11). Maximum flow rate (1.2 m/s) is indicated in the Korabelnoe channel with about the same speed on the width of the channel. In Murmansk and Nikolskij channels flow rate reaches 0.7 m/s, there are differences in flow velocity along the width of the channels. It is also shown that in Pudomzheskij, Murmanskij and Korabelnoe estuaries there are small cyclonic circulations of water.
In the period of greatest decreasing rate of sea level (7 hours after the surge peak) a complex spatial structure of water circulation is formed. In the Korabelnoe channel flow is directed towards the mouth of the river to Murmanskij channel, here it turns to Murmanskij channel, where the opposite flow happens - in the direction of the seaside wellhead of delta of the Northern Dvina river at an average speed of 0.7 m/s (Fig.12). Water circulation becomes complicated in structure taking the form of cyclonic and anticyclonic eddies in the mouth of the Murmansk. The flow in the Nikolskij channel is directed towards the seaside wellhead directly from the mouth of the river at an average speed of 0.5 m/s. The flow’s direction is from east to west with an average speed of 0.6 m/s in the Dvina Bay.
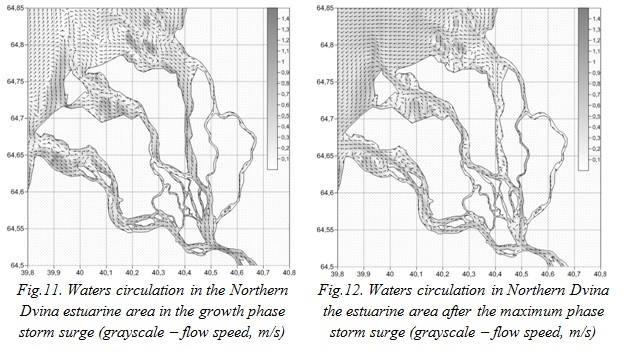
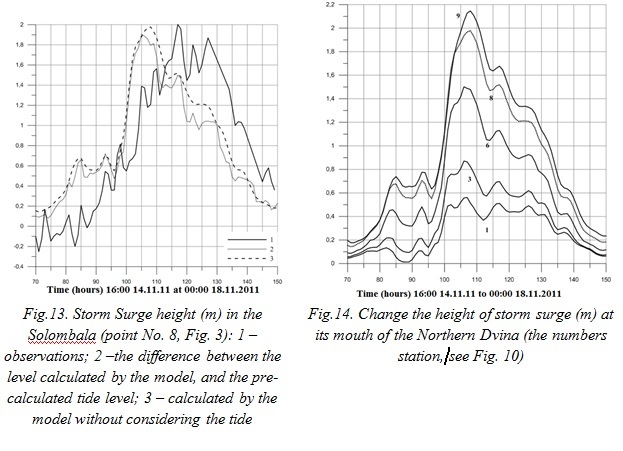
Fig. 13 shows a comparison of the height of the storm surge observational data and simulation results. (The height of the storm surge from observational data obtained as the difference between the observed level and the height of the tide precomputed.). The height of the surge in model data and field are the same, but as far as the phase is concerned, model time of the onset of the greatest height of surge is ahead of the largest maximum of observations for about 10 hours. This difference is likely due to the characteristics of the wind field of reanalysis data.
For the study of nonlinear interaction between high tide and storm surge it is common to use the difference between the level calculated on the full model, followed by net Precomputing tide level, and the level calculated by the model without considering the tide [8]. It was revealed that in the initial phase of development of surge nonlinear interaction is absent (the difference between the levels is negligible). In the phase of destruction the nonlinear interaction of the greatest surge is during the period of low water level and the lowest during the period of high water (Fig. 13).
For the study of the propagation of the storm surge from the seaside to the top of the Northern Dvina delta graphs of the height of the storm surge changes at different points of the river mouth area on the data model (Fig. 14) are drawn. At all points of the mouth area the speed level rise substantially more than its speed reduction. The rate of level rise in the region Solombala reached 1 m for 5 hours and lowering speed - 0.3 m for 5 hours. Therefore, there exists the asymmetry in the rate of change in sea level during rise and fall of sea level during the storm surge. Model results showed that the time of the maximum surge from the seaside wellhead to the mouth of the river is 2 hours (Fig. 14).
V. Acknowledgment.
The study was performed in the framework of the Russian Science Foundation (project 14-37-00038).
1. Atlas of wave and wind of the White Sea, Arhangelsk: Sev. UGKS, 1965.
2. Belov V.P., Filippov Ju.G., “Numerical simulation of total fluctuations in the White Sea”, Meteorology and Hydrology, №7, 1985, pp. 63-69 (in Russian).
3. Inzhebejkin Ju.I., White Sea level fluctuations, SPb, RGGMU, 2004 (in Russian).
4. Gusdal Y., Carrasco A., Furevik B.R., Sætra Ø. “Validation of the operational wave model WAM and SWAN”. Norwegian Meteorological Institute, Oceanography, report no. 8/2010, Oslo, 2010, 24 p.
5. Korobov V.B. “Storms in the White Sea”, Sbornik rabot Gidromettsentra Severnogo UGKS, Arhangelsk, vol. 1, 1987. pp. 59-75 (in Russian).
6. Korobov V.B. “Maximal wind waves White Sea”, Meteorology and Hydrology, №1, 1991, pp. 86-91 (in Russian).
7. Lindsay, R., Wensnahan M., Schweiger A., Zhang J. “Evaluation of Seven Different Atmospheric Reanalysis Products in the Arctic”, J. Climate, V. 27, 2014, pp. 2588-2606
8. Murty T.S. Storm surges - Meteorological ocean tides, Department of fisheries and oceans, Ottawa, 1984.
9. Myslenkov S.A., Arkhipkin V.S., Koltermann K.P. “Evaluation of swell height in the Barents and White Seas”, Moscow University Bulletin, Series 5. Geography. 2015. №5 (in Russian)
10. Resio D.T., Westerink J.J. “Modeling the physics of storm surges”, Physics Today. 2008, pp.33-38.
11. SMS Surface-water Modeling System User Manual (v11.1), 2013.
12. The "Sea of the Soviet Union". Hydrometeorology and hydrochemistry of USSR seas. Vol. 2. White Sea. Vol.1 Hydrometeorological conditions, edited by B.H. Gluhovskij, Leningrad, Gidrometeoizdat, 1991 (in Russian).
13. User manual SWAN Cycle III version 41.01AB. 2015. http://swanmodel.sourceforge.net/
14. Wind and waves in the oceans and seas. Reference data. Register USSR. - L.:Transport, 1974, 359 p., (in Russian)