


BISAC NAT010000 Ecology
BISAC NAT045050 Ecosystems & Habitats / Coastal Regions & Shorelines
BISAC NAT025000 Ecosystems & Habitats / Oceans & Seas
BISAC NAT045030 Ecosystems & Habitats / Polar Regions
BISAC SCI081000 Earth Sciences / Hydrology
BISAC SCI092000 Global Warming & Climate Change
BISAC SCI020000 Life Sciences / Ecology
BISAC SCI039000 Life Sciences / Marine Biology
BISAC SOC053000 Regional Studies
BISAC TEC060000 Marine & Naval
The study gives quantitative estimation of natural landforms sensitivity of accumulative type coasts exposed to human influence. Foredune is an essential element of a morphological structure of thebarrier spits located at the Baltic Sea sand coasts. The study compares contribution of the beach erosion and deflation (soil drifting) to the foredune degradation on the sea shore of the barrier spit with or without the recreational impact. The analysis is performed for three typical polygons located on the Russian part of the Vistula Spit. Chosen polygons present shore segments with various intensity of tourism: visitors from the village, unregulated camp tourism, and nearly natural conditions. Detailed geodesic survey was carried out on these three polygons (length 515 m, 265 m, and 521 m respectively; total area – 125000 m2) in July of 2015. It was done with single-frequency geodesic GPS Trimble 5700L1 (base station) and TrimbleR3 (rover). Two DEMs were developed using the results of laser scanning of 2007 and the survey of 2015. Volume deformation for whole polygons and its particular parts (beach and foredune ridge) was made by comparison of the DEMs. In the case of touristic load the effect of deflation is 5-15 times higher than the marine erosion of foredune edge. If not affected by an anthropogenic factor the foredune erosion is caused mainly by the sea, and its impact is 6 times higher than that of the natural deflation.
seacoasts, foredune, erosion, deflation, the Vistula Spit, the Baltic Sea.
I. Polygon selection justification
In order to determine the characteristics of the temporal dynamics for the Vistula Spit’s typical landscape, three typical polygons with varying degrees of exposure to human activities were selected. At the polygons, terrain measurements of the surface part of the Vistula Spit’s sea coast were made(Fig. 1) –hereinafter we will call the polygons in the order from north to south as polygons S (settlement), T (tourist), B (background).
|
|
|
Figure 1. – Polygon location diagram in the northern part of the Vistula Spit. |
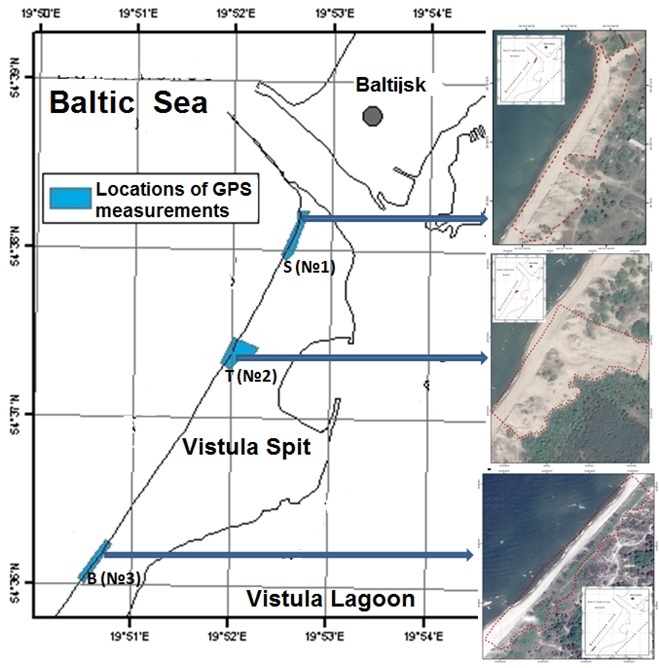
Polygon (S),length of 524 linear meters,can be characterised by a lower coastal section (from 1.5 to 8 meters in height) adjacent to the residential area of the Kosa village of Baltiysk, which was located in the northernmost part of the Vistula Spit. At the specified polygon an active anthropogenic load was recorded; the load is in the use of this coastal part by the locals and seasonal vacationers for recreational purposes, unauthorised driving down by car to the beach for fishing and collecting amber in the near shore zone.
Polygon (T),length of 272 linear meters, is located at a distance of about two kilometres to the south of the Strait of Baltiysk. Polygon (T) represents a high portion (5 to 14 meters in height) of the coast with intense recreational load caused by the unorganised mass tourism. An active anthropogenic load is expressed in the use of that part of the coast by plenty of seasonal vacationers and tourists for recreational purposes and for open air events. [1] In contrast to the first polygon, it is not possible to freely access the beach because of the rather high foredune there.
Polygon (B), length of 526 linear meters, can be characterised by the state of the natural coast in height from 8 to 12 meters, which is not subjected to intense anthropogenic pressure and is located at a distance of about five kilometres south of the Strait of Baltiysk. Due to significant remoteness from a populated centre and the lack of access roads near the coast, the said polygon is visited by few tourists mostly when the surroundings are passed by bike. The area is dominated by coastal processes caused mostly by natural processes. That is why the polygon was taken for a comparative analysis as a background.
The total area of the three studied polygons is about 113,000 m2, where the first polygon is about 40,000 m2, the second polygon is about 40,000 m2 and the third polygon is 33,000 m2respectively.
II. Measurement and analysis techniques
To obtain the field data on the polygon terrains on the Vistula Spit sea shore, a GPS survey of three-dimensional coordinates (latitude, longitude, altitude) of the points of the above-water part of the beach and the foredune surface with a system of the single-frequency geodetic GPS Trimble 5700L1 (base station) and TrimbleR3 (mobile receiver) was performed. The minimum mean-square error of the measurement data with the system in an ideal mode is ± 10 mm + 1 ppm in plain view and 20 mm ± 1 ppm + in elevation.
For Polygon (S) from 22,606 measured points selected were 21,059 points, the measurement errors of which lie in a pre-determined limit (<0.5 m), which represents 93.1% of all measurements at this polygon. The average density of points on the polygon was 1 point per 1.9 m2.
At Polygon (T),in total,21,720 measurements were conducted; of which 19,663 (90.5%) are within the specified measurement error (<0.5 m). The average density of points on the polygon was 1 point per 2.3 m2.
Within the range of Polygon (B) almost all 16,106 points lie within a pre-determined measurement error (<0.5 m), and only one point was an exception. The average density of points on the polygon was 1 point per 2 m2.
The key objective of the study was to determine the terrain deformation on the selected polygon for the period from 2007 to 2015. For comparison of the terrain of the sea coast obtained as a result of the GPS survey in 2015, and the terrain obtained by airborne laser scanning in 2007, performed was mutual binding of the data made with GIS tools.
After the planned altitude data correction, the data interpolation was performed to produce three-dimensional terrain models for 2007 and 2015. The interpolation was carried out in GIS by the Inverse Distance Weighted Interpolation method resulting in three-dimensional digital elevation models (DEM) were obtained with a resolution of 0.5 m in plan. For zero surface taken was the ellipsoidal surface used in the WGS-84 coordinate system and reduced to the Baltic height system BK77, the system of normal heights which are counted from the zero level of the Kronstadt tide gauge.
A terrain deformation (change) analysis is conducted relief by deducting from the 2015 model of DEM height values for 2007 which made it possible to identify the areas of positive and negative deformation on polygons and assess their areas and volumes. DEM have been constructed for all the polygons as well as separately for polygon parts, the beach and foredune. This approach allowed us to perform the calculation and analysis of terrain changes differentially between the beach and foredune by separating the beach as a dynamic element of the sea coast.
Two components of the foredune deformation were assessed separately: the one due to direct wave erosion and the second, due to deflation processes strengthened by recreation load (on the first two polygons). This analysis was a basis of assessment of the specific characteristics: the volume of foredune degradation due to wave erosion per one running meter of coastline; the volume of foredune degradation due to deflation (eolian-anthropogenic factor)per one running meter of coastline. These specific characteristics may be used in the future to estimate dune degradation for similar areas of the shore.
III. RESULTS
First polygon(S)
The estimated volume of material on the entire polygon, according to 2007 airborne laser scanning, amounted to 134,202 m3; and according to the 2015 GPS survey results it is 100,600m3 which indicates a decrease in the volume of material in that section of the sea coast in 2015 compared to 2007 by 33,603 m3 and is about 25% of the original volume (the volume in 2007). (Figure 2). On a blank part in the middle of the polygon there is a wood tree belt area which was excluded from the calculation in order to reduce the degree of measurement error.
|
|
|
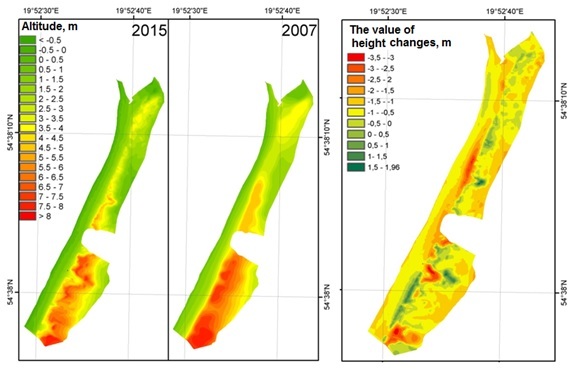
Figure 2. Digital terrain models of the polygon (S) for 2007 and 2015 and the scheme of changing terrain elevations within the polygon (S) in 2007-2015. |
The foredune makes the main contribution to the material volume change of Polygon (S) as the results of calculation of the material volume change within the foredune and beach separately indicated:
- the foredune material volume for the period from 2007 to 2015 decreased by 25,126 m3(21.3%) representing 74.8% of the total material volume changes on the polygon;
- the beach material volume calculated according to 2007 data is greater that the volume of material in 2015 by 8,477 m3 which corresponds to 25.2% of the total volume of material changes on the polygon.
For the entire polygon, the range of the numerical values of the terrain change is from -3.49 to 1.96 m, i.e. the deformation change amplitude is 5.45 m. The positive deformations hold only 6.2% of the polygon area corresponding to 2 474 m2, the negative deformations hold the remaining 93.8 % of the polygon equal to 7,231 m2 .
Most likely, reduction of the foredune dimensions within Polygon (S) is due to the combined effect on the coast of the wave, eolian and anthropogenic factors. Under the influence of the sea waves reaching the foredune during storms, there is erosion of the sea foredune slope with the loss of a large number of sandy material, and as a consequence, a decrease in the size (volume) of the foredune. The eolian transfer on the seashore promotes accretion and retirement of the sand material:
- under the influence of the wind, the accretion of the sand material at the foredune bottom and on its surface occurs, and;
- wind redistributes the sandy material along the profile of the coast and beach within the foredune;
- deflation processes lead to the formation of deflation hollows and the gradual destruction of the integrity of foredune body.
The main impact of the anthropogenic factor is that it aggravates and accelerates the appearance of other destructive processes. Basically, this is manifested at Polygon 1 in that as a result of the residents’ and tourists’ mass visiting this area in the absence of elemental traffic arrangements (equipped lanes and access roads to the beach) there is widespread trampling of vegetation and surface damage of the foredune thus increasing deflation by several times. [2]
An analysis of the changed material volume of the foredune in terms of the contribution of the above processes was also performed. The calculated difference in volumes of 2007 and 2015 was divided by the part resulting from the action of the sea (retreat of the sea slope of the foredune) and the part resulting from the eolian-human activities. The negative values of changes in the terrain in the rear of the foredune and within deflation hollows on the sea slope and the foredune top were taken as the amount lost due to the eolian-human activities; the rest of the lost material volume was taken as the volume of material lost when exposed to the wave factor. Thus, under the impact of the eolian-anthropogenic factor the foredune lost 21,481 m3 of material, which is 85.5% of the total volume of the lost material. The lost material volume lost as a result of sea activities account for the remaining 14.5%.
From the above it can be concluded that concerning Polygon (S),the human impact on the foredune leads to the activation of destructive eolian processes, the impact of which is five times greater than the erosion of the sea slope of the foredune ridge caused by the sea.
Second polygon (Т)
The estimated volume of material on the entire polygon was 261,748 m3 in 2007, and in 2015 the material volume of is reduced by 39,457m3 amounting to 222,291 m3. As a result, the total amount of the polygon material decreased by 15.1% in 2015 compared to 2007 (Figure 3)
|
|
|
Figure 3. Digital terrain models of Polygon (T) for 2007 and 2015. and the terrain elevation change diagram within the polygon (T) in 2007-2015. |
.png)
The main changes in the material and terrain volumes recorded within the polygon with foredune ridge. Volume foredune ridge material decreased by 35,301 m3 accounting for 89.5% of the whole difference between the material volumes. There are no positive deformations within the beach.
For the entire polygon, the whole range of change in the numerical values of the terrain deformations is from -10.7 to 4.8 m, i.e. the amplitude of the deformation change is 15.5 m. The positive deformations occupy 25.3% of the polygon area, which corresponds to 10,063 m2, the negative deformations occupy the remaining 74.7% of the polygon equal to 29,665 m2.
For the foredune the area of negative deformations reached 22,919 m2 which corresponds to 71% of the whole foredune area. In turn, positive deformations occupy 10,063 m2 or 29% of the total area of the foredune.
According to the performed calculations, the impact of deflation-human factor within the foredune of Polygon (T) is much stronger than that of the wave type. Thus, as a result of exposure to wind and human activities, the foredune material volume within the polygon under research decreased by 33,071 m3thus accounting for 93.7% of the total change in the foredune material volume. Consequently, the man-induced impact on the foredune leads to the activation of destructive eolian processes, the impact of which is in many respects exceeds the erosion of the sea slope of the foredune caused by the influence of the sea. An intensive course of destructive eolian processes resulted in the formation within the polygon in the foredune body of a through deflation hollow and a semi-through hollow, via which holiday-makers move to the sea and back. The polygon’s accretion sections generally correspond to the foredune surface portions covered with vegetation, forested rear slope and the portions of the base of the rear slope, where deposition of sandy material mainly occurs as a result of the eolian transport. [3]
Third polygon (В)
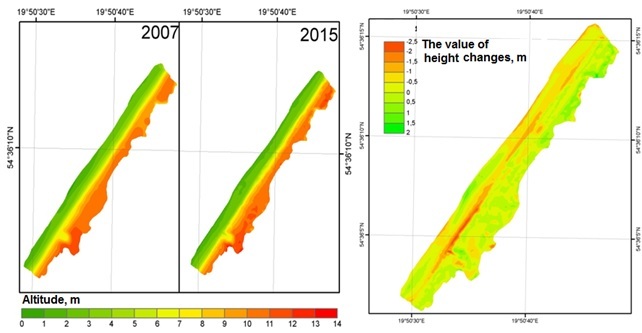
The estimated volume of material on the entire polygon in 2007 was 221,071m3 in 2015 the volume of the material decreased by 9,126 m3 and amounted to 211,945 m3. As a result, the total amount of the polygon material in 2015 decreased by 4.1% compared to 2007 (Fig. 4)
|
|
|
Figure 4 - Digital terrain models of the polygon (B) for 2007 and 2015 and the scheme of changing terrain elevations within the polygon (S) in 2007-2015. |
The main changes in the material and terrain volumes occurred with the foredune within the polygon. The foredune material volume decreased by 6,438 m3 accounting for 70.5% of the difference between the material volume. The amount of the beach material decreased by 2,688 m3.
For the entire polygon the range of the numerical values of the terrain deformations is from -2.5 to 1.9 m, i.e. the amplitude of the deformation changes is 4.4 m. The positive deformations occupy 35.1% of the polygon area, which corresponds to 10,720m2,the negative deformations occupy the remaining 67.9% of the polygon area corresponding to 22,722 m2.
The positive deformations within the beach occupy an area of 2,046 m2, or 22.8%, the negative deformations were subjected to the remaining 77.2% of the beach area (6,921 m2).
The range of the change in the deformation values is equal to 4.4 m and is from -2.5 to 1.9 m. For the foredune the of the negative deformations reached 8,669 m2 which corresponds to 35.5% of the total area of the foredune. Positive deformations, in turn, occupy 15,772 m2 or 64.5% of the total area of the foredune.
This polygon is different from the other two by the degree of human impact which is relatively low in this part of the Vistula Spit. The calculated amount of the reduced foredune material because of deflation here was 871 m3 or 13.5% of the total volume of the lost material of the foredune. The remaining 86.5% (5,567 m3) of the lost material volume of the foredune ridge account for these a storm effects. The action of eolian processes on the territory of the polygon is manifested mainly in a deflationary depression area in the southern part of the polygon, where there is a path and access to the sea. As a result, destructive eolian processes at the part of the sea coast as well as in the rest of the polygons occur mainly with the anthropogenic factor.
All parameters and characteristics of polygon changes and changes of marine shore of Vistula Spit because of influence main natural an anthropogenic factors for the period from 2007 to 2015, are shown in Tabl. 1
IV. Conclusions
Based on the results of the research within three reference polygons on the coast of the Vistula Spit, you can draw conclusions about the prevalence of the eolian component in the destruction of the sandy foredune body given the simultaneous man-induced impact.
Polygons (S and T) can be characterised by active anthropogenic influence as Polygon (S) is located in the Kosa village, and Polygon (T) is subjected to the intensive load by uncontrolled tourism. Within these polygons there is an intense impact from the deflationary processes leading to the creation of deflation hollows and destruction of the foredune surface. The main-induced factor within these polygons is the main cause of the intensive deflation. The disorganised mass movement on the foredune of a large number of holidaymakers leads to the degradation and destruction of foredune vegetation performing the function of sand binding.
An assessment of the foredune material volume changes according to 2007 and 2015 data shows that for Polygons (S and T) a decrease in the foredune material volume is primarily due to the deflationary process. At Polygon (S) contribution of the deflation to the reduction of the material volume was 85.5% and at Polygon (T) it is 93.7%, indicating that the prevalence of the eolian component over the influence of the sea in the foredune destruction.
At the same time, at Polygon (B), where the degree of the man-induced impact is relatively small compared to the two other polygons, the major role in destroying foredune is by its destruction by the sea. The main share in the decrease in the foredune material volume within the polygon by the sea erosion, the contribution of which amounted to 86.5% in percentage terms.
Table 1. Characteristics of parts of marine shore of the Vistula Spit on polygons and their changes for the period from 2007 to 2015 because of influence of main natural and anthropogenic factors
|
Polygon parameters |
Polygon(S) |
Polygon(Т) |
Polygon(В) |
||||||
|
Polygon
|
Beach |
Foredune |
Polygon |
Beach |
Foredune |
Polygon |
Beach |
Foredune |
|
|
L, m |
524 |
524 |
524 |
272 |
272 |
272 |
526 |
526 |
526 |
|
S, m2 |
39705 |
11200 |
28505 |
39728 |
6746 |
32982 |
33442 |
8967 |
24441 |
|
V2007, m3 |
134202 |
16115 |
118087 |
261748 |
9006 |
252742 |
221071 |
19090 |
200784 |
|
V2015, m3 |
100600 |
7638 |
92962 |
222291 |
4852 |
217441 |
211945 |
16402 |
194346 |
|
∆V, m3 (%) |
33603 (100) |
8477 (25.2) |
25126 (74.8) |
39457 (100) |
4154 (10.5) |
35301 (89.5) |
9126 (100) |
2688 (29.5) |
6438 (70.5) |
|
∆Vdefl.,m3 (%) |
- |
- |
21481 (85.5) |
-
|
- |
33071 (93.7) |
-
|
- |
871 (13.5) |
|
∆Veros, m3 (%) |
- |
- |
3645 (14.5) |
- |
- |
2230 (6.3) |
- |
- |
5567 (86.5) |
|
S+ ,m2 (%) |
2474 (6.2) |
10756 (96.0) |
2051 (7.2) |
10063 (25,3) |
0 (0) |
10063 (29) |
10720 (35.1) |
2046 (22.8) |
15772 (64.5) |
|
S-, m2 (%) |
37231 (93.8) |
443,5 (4.0) |
26455 (92.8) |
29665 (74,7) |
6746 (100) |
22919 (71) |
22722 (64.9) |
6921 (77.2) |
8669 (35.5) |
|
UE |
- |
- |
0.87 |
- |
- |
1.02 |
- |
- |
1.32 |
|
UD, m3/m/year |
- |
- |
5.12 |
- |
- |
15.2 |
- |
- |
0.21 |

Symbols: L–the length of polygon; V- the volume of material, DEM on zero surface;∆V – difference between the volume of material DEM of 2007 and 2015; ∆Vdefl. –difference between the volume material DEM of 2007 and 2015 as results of foredune deflation (eolian-anthropogenic factor); ∆Veros- difference between the volume material DEM of 2007 and 2015 as results of storms (natural factor); S+- the area of positive deformations; S- - the area of negative deformations; UE - the unit volume of foredune erosion due to wave action per running meter per year; UD- the unit volume of foredune deflation (eolian-anthropogenic factor per running meter per year.
For the first time, during the research obtained was a numerical assessment of the impact on the sandy seashore from the Vistula Spit destructive factors such as sea erosion, deflation and the impact of man. The simultaneous effects of anthropogenic factors and eolian foredune on the surface leads to intense leakage deflation that surpasses the marine erosion by more than 5-15 times. However, in the absence of anthropogenic influence the main contribution to the foredune destruction ridge is from the sea erosion exceeding deflation by 6 times.
In conclusion, it should be noted that the Vistula Spit provides another example of what the sea sandy shores of the accretion type are extremely sensitive to the man-induced impact and the implementation of any activities within these shores should be carried out taking into account this fact.
V. Acknowledgement
Technical facilitation of the study, problem identification, data analysis and chose of the polygons were made under support of the theme № 0149-2014-0017 (supervisor – B. Chubarenko) of State Assignment of the P.P.Shirshov Institute of Oceanology of the Russian Academy of Sciences (2015-2017). The polygon survey and preparation of this article was made under the support of the Project No 14-17-00547 “A forecast development for evolution of accumulative Russian coasts of tide less seas”
1. V.P. Bobykina, “Morphology and Dynamics of the Sea Coast of the Northern Section of the Vistula Spit,” Environmental Problems of the Kaliningrad Region and the Baltic Sea Region, Kaliningrad: research set by the publisher of the I. Kant State University, 2007, pp. 20-26.
2. Е.М. Burnashov, “The modern geo-ecological conditions of the Sea Coast in Kaliningrad Region,” Create artificial beaches, islands and other structures in the coastal zone of the seas, lakes and reservoirs, Novosibirsk: Publishing House of the SB RAS pp. 111-114, August 2011 [Proceedings of the 2nd International Conf. “Construction of the Artificial Lands in the Coastal and Offshore Areas”, Novosibirsk, August 1-6, 2011].
3. Т.V. Shaplygina and I.I. Volkova, “Modern natural and man-induced pre-conditions of transformation of the eolian coastal marine natural complexes,” Vestnik Immanuel Kant Baltic Federal University, vol. 1, pp.39-46. 2013.