Санкт-Петербург, г. Санкт-Петербург и Ленинградская область, Россия
BISAC NAT010000 Ecology
BISAC NAT045050 Ecosystems & Habitats / Coastal Regions & Shorelines
BISAC NAT025000 Ecosystems & Habitats / Oceans & Seas
BISAC NAT045030 Ecosystems & Habitats / Polar Regions
BISAC SCI081000 Earth Sciences / Hydrology
BISAC SCI092000 Global Warming & Climate Change
BISAC SCI020000 Life Sciences / Ecology
BISAC SCI039000 Life Sciences / Marine Biology
BISAC SOC053000 Regional Studies
BISAC TEC060000 Marine & Naval
This project defines the pre-industrial quantities of heavy metals in sediment sequences of the Late Holocene from the Eastern Gulf of Finland. A comparative analysis reveals differences and similarities in the current concentrations of heavy metals in bottom sediments and pre-industrial levels. It is found that the maximum concentrations of heavy metals in the bottom sediments of the Gulf of Finland and Neva Bay occurred in the period of 1950-1990. Since the 1990s, the trend has been a slow decline in the contamination levels; however, the concentrations of some heavy metals in bottom sediments remain high.
sediments, Gulf of Finland, sediment contamination, heavy metals.
I. Introduction
Heavy metals and chemical toxicants are known to accumulate in different components of marine environments, causing vital changes in biological species and damage to the ecosystem. Because they can potentially migrate from sediments to water, sediment contamination is among the most urgent problems requiring ecological and geological research.
The Gulf of Finland is exposed to heavy metal pollution from adjoining urban areas. To preserve the ecosystem of the Baltic Sea, it is necessary to continuously monitor and evaluate the state of the environment. The problem is especially urgent for the easternmost part of the Gulf of Finland, where in the late 1990s, the concentrations of most heavy metals were extremely high [10, 13, 14].
Today, there are no established ecological sediment quality criteria in Russia, despite such indicators having already been developed by many other countries and organizations.
In developing such criteria, the pre-industrial quantities of heavy metals, representing a natural state in sedimentary sequences, and their relation to palaeoenvironmental settings have become the most important topics.
II. Materials and methods
The sediments of the eastern Gulf of Finland have been the subject of many scientific studies and of monitoring over the last two decades. Ecological and geological surveys in the Russian part of the Gulf of Finland were held in the 1990s within the framework of national projects and international expeditions, such as the Baltic Marine Ecological Patrol (MEP). Within the context of the project State Monitoring of geological environment of the Russian part of Baltic Sea, the state company “Sevmorgeo” and the A.P. Karpinsky Russian Geological Research Institute “VSEGEI” conducted annual sediment sampling within the Gulf of Finland (35-38 sites) and Neva Bay (34 sites) from 2005 to 2015. Sediment sampling was conducted using a grab sampler and box-corers, which made it possible to obtain qualitative data and stratified sediment samples. Analytical investigations included the determination of heavy metal concentrations in surface sediments. Consequently, a unique database was collected comprising records of the state of surface sediments in the eastern Gulf of Finland [2, 3, 4, 5, 6, 7]. In addition, undisturbed sedimentary sequences (length 50-60 cm, using the Niemistö gravity corer) from areas of silty clay accumulation, which were recovered during the joint projects of VSEGEI and GTK (Geological Survey of Finland), and their detailed sampling and chemical analyses [14, 15, 16] revealed the vertical distribution of heavy metals in bottom sediments in different sedimentation basins of the eastern Gulf of Finland.
Surface sediments, collected within the framework of the geological monitoring project, were analysed by semiquantitative optical emission spectral analysis (27 elements, including Co, Ni, Cu, Pb, Zn, Cr and V). ICP-MS was used for chemical analyses of Cd and As.
III. Results and discussion
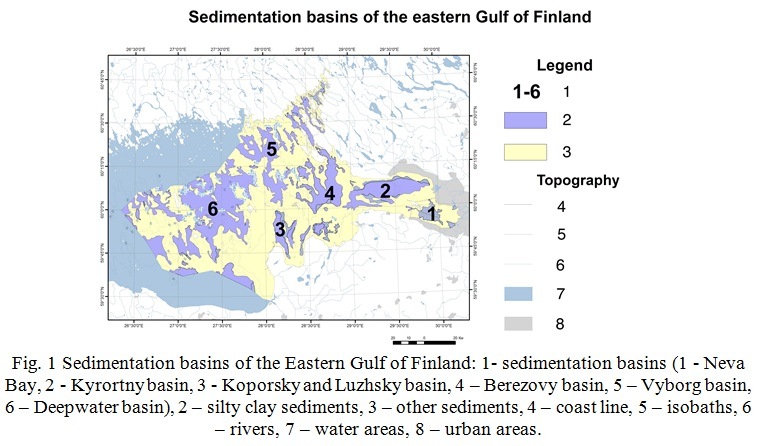
Silty clay sediments are known to intensively absorb and accumulate heavy metals and pollutants; their deposition occurs in local sedimentation basins in the eastern Gulf of Finland. These basins are located in depressions of bottom relief at depths varying from 4-5 m in Neva Bay to 50-60 m near Gogland Island. The depressions are separated by raised bottom areas, characterized by a prevalence of erosion processes, transit, a lack of sedimentation and the formation of coarse-grained sediments, sands and mixed sediments. In the framework of the presented study, six sedimentation basins (including the Neva Bay sedimentation basin) were distinguished by their differences in bathymetry, their source of incoming material and the specifics of their hydrochemical regime (Fig. 1).
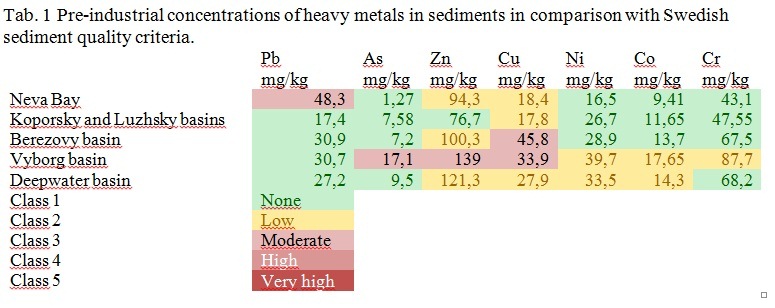
Published data on the vertical distribution of heavy metals in the upper 50-60 cm of soft silty-clay mud [14, 15, 16] allowed us to calculate the pre-industrial values for each sedimentation basin (excluding the “Kurortny” basin), obtained from intervals from 25-30 cm to 40-60 cm depending on the sedimentation rate. The concentration curves show a drastic increase in the concentration of heavy metals in the intervals corresponding to the 1950-1990s. Underlying sediments were interpreted as representing a “natural state” and assumed to be unaffected by human activities. The pre-industrial quantities of heavy metals and their relation to the environmental quality criteria developed by Swedish Environmental Protection Agency [12] are shown in Tab. 1 and Fig. 2.
It is worth noting that some of these values match classes 2 and 3 of the Swedish sediment quality criteria (“low” and “moderate” level of pollution) (Tab. 1). When analysing the technogenic impact, it is necessary to take this aspect into account. Elevated levels of most of the examined elements are specific for the northwestern basins. The highest pre-industrial values of Zn, Ni, As, Co, Cr and V apply to the bottom sediments of Vyborg and that of Cu applies to the Beresovy sedimentation basin (Fig. 2). These features are most likely caused by the geological structure of the eastern Gulf of Finland. Sedimentation basins in the northern part of the Gulf are associated with the crystalline basement of the Baltic Shield. The eroded material from the rocks of the shield appears to be a source of a wide range of chemical elements transported to the basins. Apparently, this case is an example of natural enrichment of the bottom sediments. Reduced levels of heavy metals are noted for the sediments of the Koporsky and Luzhsky basins, where supply results from the rocks of the sedimentary platform, which are significantly less enriched with ore elements [1].
Based on the geochemical data acquired during annual monitoring from 2012-2015 by Sevmorgeo and VSEGEI, average heavy metals concentrations were calculated for different sedimentation basins. This interval was proposed due to it having the most complete database (Fig. 3).
Comparative analysis shows that the concentrations of all of the studied elements in surface sediments exceed those in the pre-industrial deposits. The most significant increases occurred in As, Zn and Cu. Generally, for the modern and pre-industrial sediments, enhanced values are inherent for northern basins, pointing toward the essential contribution of natural processes in the geochemical specialization of modern silty clay accumulation.
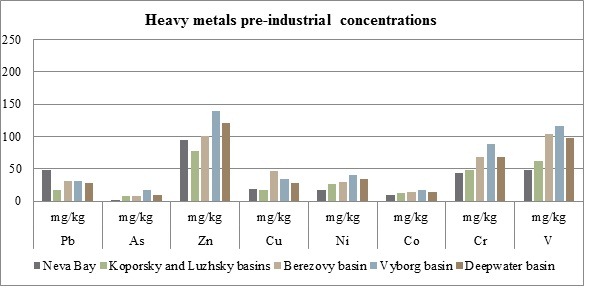
Fig.2 Heavy metals pre-industrial concentrations
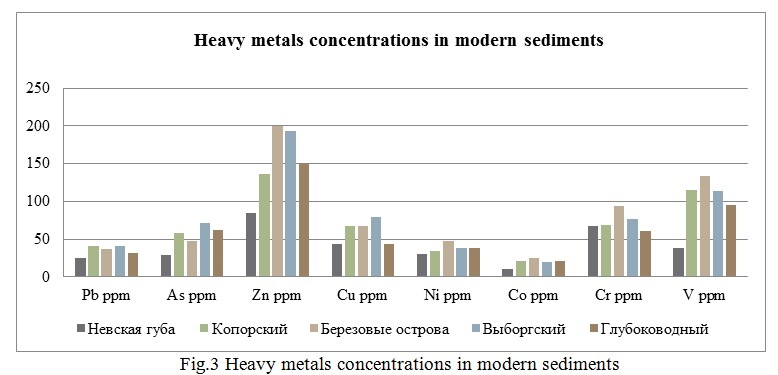
In comparison with pre-industrial levels, the concentrations of arsenic increased significantly. Maximum concentrations were found in the Vyborg basin, where values raised from 17 ppm in pre-industrial sediments to 71 ppm in modern deposits.
The concentration of zinc increased in comparison with pre-industrial values in all sedimentation basins. However, the maximum pre-industrial levels existed in the northern and western areas, whereas now peak concentrations are distinctive for the area of the Berezovy basin.
The concentration of lead increased in the Koporsky and Luzhsky basins in modern soft sediments, whereas it decreased in Neva Bay. This result requires additional investigation. The underlying interval of the sequence 05-NG-9 (26-38 cm), representing significantly lower levels of heavy metals than in the “industrial” interval of 1950-1990s, have probably not reached the “natural” state for sediments of this basin. Generally, in the surface sediments of the eastern Gulf of Finland, concentrations of lead for different basins are quite similar, perhaps, due to the enhanced mobility of this element.
The maximum levels of copper in the pre-industrial levels were fixed in the sedimentation basin “Berezovy”. In the surface sediments, peak values were noticed in the central part of the bay – i.e., the “Koporsky and Luzhsky basins”, the “Vyborg” basin and the “Berezovy” basin.
The changes in the concentrations of Co and Ni were insignificant in comparison with pre-industrial values. Peak levels moved south from the Vyborg area to the “Berezovy” basin. The same trend was observed on the figures for chromium and vanadium; however, these values increased in comparison to pre-industrial intervals.
Summarizing the obtained results, we can conclude that the maximum concentrations of Zn, Ni, Co, Cr and V shifted south from the Vyborg basin to the “Berezovy” area. During the pre-industrial period, the distribution of elements was controlled by geological and physiogeographical settings, whereas today a huge role is assigned to human activities. A huge harbour, a variety of waterways and shipping channels are located in the “Berezovy” area, influencing the content of heavy metals in sediments.
When conducting a comparative analysis, attention was paid to the elevated levels of most elements in the northern basins in the modern and pre-industrial periods, whereas reduced levels were noticed in Neva Bay and the “Koporsky and Luzhsky basins”. It is worth noting that the study from the 1990s revealed the opposite result – maximum concentrations were fixed in the eastern part of the bay (Neva Bay and the Kurortny district).
The determined patterns indicate a reduction in the anthropogenic load in the eastern Gulf of Finland over the last decade and the essential contribution of natural components to modern sedimentation processes.
A diagram showing annual geochemical data for sedimentation basins collected during monitoring in 2005-2015 is presented at Fig. 4.
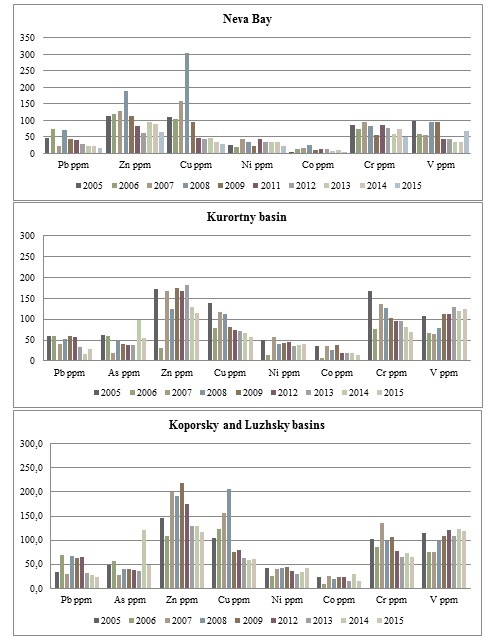
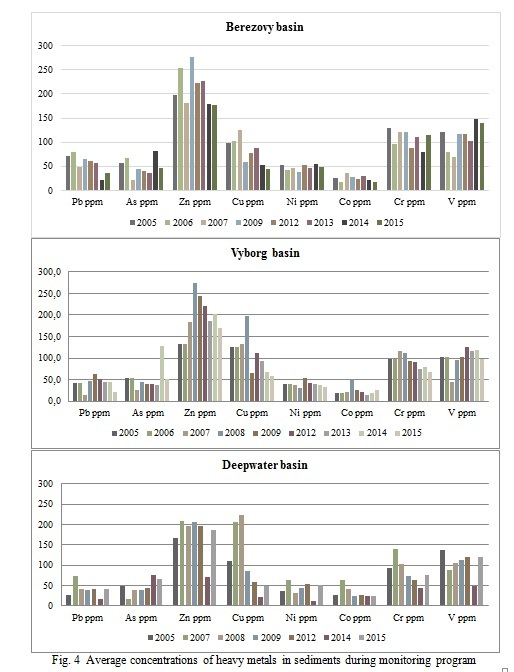
Based on the results of the annual investigations, it is possible to make several conclusions. In almost all basins, a sharp increase in the concentrations of heavy metals occurred in 2007-2009. This elevation was traced most clearly in Neva Bay; nevertheless, high concentrations were noticed in the other basins. Due to hydro technical work held in 2006-2008 (dredging, underwater dumping, new territories creation etc.), the water became oversaturated with suspended matter, which led to the secondary pollution of water and deposits by underlying sediments.
In Neva Bay, the average concentrations of metals, except Cu, decreased during the studied interval. The content of lead has gradually decreased over the past ten years from classes “high” and “moderate” to “none”. Ni reached class 3, “moderate”, in 2007 and 2011, Co did so in 2008. Other elements did not exceed the first two contamination levels [11]. The concentrations of Cu exceeded level 3 pollution during the previous nine years of investigations and decreased in 2015 to class 2, “low”.
In the sedimentation basin “Berezovy”, slight decreases in Pb, Zn, Cu and Co concentrations were noticed. Other elements show stable levels, except V, the concentration of which increased during the monitoring program. According to Swedish quality criteria, all values exceeded the third level of pollution.
Within the project, a decline in the concentrations of Pb, Zn, Cu, Со and Cr occurred in the Kurortny, Koporsky and Luzhsky basins. The vanadium content was slightly elevated, whereas the other elements remained on the same levels.
The Vyborg and Deepwater basins are characterized by enhanced levels of As, Zn and Co. In the Vyborg basin, the values of Pb, Zn, Cu, Ni and Cr have decreased over the last ten years, whereas the patterns of other elements remained constant. The Deepwater basin is distinctive for its permanent concentrations of most of the studied elements; nevertheless, the decline in Cu, Cr and Co values was fixed.
A comparison of average concentrations in different sedimentation basins of the Gulf of Finland with the Swedish sediment quality criteria is shown in Tab. 2.
Table 2. Average concentrations of heavy metals in sediments during the monitoring program in comparison with Swedish sediment quality criteria
Neva Bay
|
Pb ppm |
Zn ppm |
Cu ppm |
Ni ppm |
Co ppm |
Cr ppm |
|||||||||||||||||||||||
|
2005 |
46 |
113 |
110 |
26 |
5 |
87 |
|
|||||||||||||||||||||
|
2006 |
75,5 |
119 |
104,5 |
21 |
14,5 |
73,5 |
|
|||||||||||||||||||||
|
2007 |
21,5 |
128,5 |
160 |
45 |
16 |
94,5 |
|
|||||||||||||||||||||
|
2008 |
71 |
188 |
305 |
35 |
27 |
84 |
|
|||||||||||||||||||||
|
2009 |
43 |
113,5 |
94 |
23,5 |
11,5 |
55 |
|
|||||||||||||||||||||
|
2011 |
40,05 |
82,05 |
48,15 |
43,9 |
13,45 |
85,65 |
|
|||||||||||||||||||||
|
2012 |
29,6 |
62 |
44,8 |
36 |
13 |
77 |
|
|||||||||||||||||||||
|
2013 |
24 |
95 |
47 |
35 |
8,5 |
59 |
|
|||||||||||||||||||||
|
2014 |
23 |
88 |
35 |
34 |
9,1 |
75 |
|
|||||||||||||||||||||
|
2015 |
17 |
66,5 |
29,5 |
23,5 |
4 |
50,5 |
|
|||||||||||||||||||||
|
Berezovy basin |
|
|||||||||||||||||||||||||||
|
|
Pb ppm |
As ppm |
Zn ppm |
Cu ppm |
Ni ppm |
Co ppm |
Cr ppm |
|
||||||||||||||||||||
|
2005 |
72 |
56 |
198 |
99 |
53 |
25 |
130 |
|
||||||||||||||||||||
|
2006 |
80 |
68 |
254 |
103 |
42 |
17 |
96 |
|
||||||||||||||||||||
|
2007 |
48 |
21 |
181 |
125 |
47 |
37 |
122 |
|
||||||||||||||||||||
|
2009 |
64 |
44 |
276 |
59 |
39 |
27 |
121 |
|
||||||||||||||||||||
|
2012 |
60 |
41 |
222 |
76,5 |
52 |
24 |
87 |
|
||||||||||||||||||||
|
2013 |
57 |
35 |
226 |
87 |
46 |
29 |
110 |
|
||||||||||||||||||||
|
2014 |
21 |
81 |
180 |
52 |
55 |
21 |
79 |
|
||||||||||||||||||||
|
2015 |
35 |
45,5 |
177,5 |
45 |
48 |
18 |
115 |
|
||||||||||||||||||||
|
Vyborg basin |
|
|||||||||||||||||||||||||||
|
2005 |
41 |
54 |
133 |
125 |
41 |
19 |
98 |
|
||||||||||||||||||||
|
2006 |
41 |
54 |
133 |
125 |
41 |
19 |
98 |
|
||||||||||||||||||||
|
2007 |
16 |
25 |
184 |
134 |
39 |
22 |
117 |
|
||||||||||||||||||||
|
2008 |
48 |
44 |
274 |
197 |
30 |
52 |
111 |
|
||||||||||||||||||||
|
2009 |
64 |
41 |
245 |
65 |
53 |
26 |
94 |
|
||||||||||||||||||||
|
2012 |
53 |
40 |
220 |
113 |
43 |
22 |
92 |
|
||||||||||||||||||||
|
2013 |
46 |
39 |
187 |
92 |
40 |
14 |
74 |
|
||||||||||||||||||||
|
2014 |
45 |
127 |
202 |
67 |
38 |
19 |
79 |
|
||||||||||||||||||||
|
2015 |
21 |
51 |
170 |
59 |
33 |
26 |
67 |
|
||||||||||||||||||||
|
Deepwater basin |
|
|||||||||||||||||||||||||||
|
2005 |
28 |
49 |
168 |
110 |
37 |
27 |
94 |
|
||||||||||||||||||||
|
2007 |
74 |
17 |
209 |
206 |
64 |
63 |
139 |
|
||||||||||||||||||||
|
2008 |
40 |
40 |
197 |
224 |
31 |
41 |
102 |
|
||||||||||||||||||||
|
2009 |
38 |
40 |
206 |
85 |
45 |
25 |
72 |
|
||||||||||||||||||||
|
2012 |
40 |
43 |
196 |
60 |
54 |
27 |
63 |
|
||||||||||||||||||||
|
2014 |
16 |
77 |
70 |
22 |
11 |
25 |
44 |
|
||||||||||||||||||||
|
2015 |
41 |
67 |
186 |
50 |
51 |
23 |
75 |
|
||||||||||||||||||||
|
Kurortny basin |
|
|||||||||||||||||||||||||||
|
2005 |
60 |
63 |
173 |
140 |
50 |
35 |
168 |
|
||||||||||||||||||||
|
2006 |
59 |
60 |
32 |
78 |
14 |
7 |
76 |
|
||||||||||||||||||||
|
2007 |
41 |
20 |
168 |
118 |
57 |
36 |
136 |
|
||||||||||||||||||||
|
2008 |
53 |
48 |
124 |
112 |
40 |
26 |
126 |
|
||||||||||||||||||||
|
2009 |
59 |
39 |
174 |
82 |
43 |
37 |
103 |
|
||||||||||||||||||||
|
2012 |
57 |
38 |
167 |
75 |
45 |
19 |
95 |
|
||||||||||||||||||||
|
2013 |
33 |
38 |
182 |
71 |
36 |
19 |
96 |
|
||||||||||||||||||||
|
2014 |
17 |
98 |
130 |
66 |
37 |
18 |
82 |
|
||||||||||||||||||||
|
2015 |
29 |
55 |
116 |
57 |
39 |
14 |
69 |
|
||||||||||||||||||||
|
Koporsky and Luzhsky basins |
|
|||||||||||||||||||||||||||
|
2005 |
34 |
49 |
146 |
105 |
42 |
23 |
102 |
|
||||||||||||||||||||
|
2006 |
70 |
57 |
109 |
124 |
26 |
9 |
85 |
|
||||||||||||||||||||
|
2007 |
30 |
27 |
201 |
157 |
40 |
26 |
135 |
|
||||||||||||||||||||
|
2008 |
66 |
40 |
192 |
206 |
43 |
18 |
97 |
|
||||||||||||||||||||
|
2009 |
64 |
40 |
218 |
76 |
44 |
24 |
107 |
|
||||||||||||||||||||
|
2012 |
66 |
37 |
175 |
79 |
37 |
22 |
77 |
|
||||||||||||||||||||
|
2013 |
32 |
36 |
129 |
63 |
30 |
16 |
66 |
|
||||||||||||||||||||
|
2014 |
28 |
122 |
130 |
58 |
35 |
30 |
73 |
|
||||||||||||||||||||
|
2015 |
24 |
49 |
116 |
60 |
43 |
15 |
66 |
|
||||||||||||||||||||
|
Class 1 |
None |
|
||||||||||||||||||||||||||
|
Class 2 |
Low |
|
||||||||||||||||||||||||||
|
Class 3 |
Moderate |
|
||||||||||||||||||||||||||
|
Class 4 |
High |
|
||||||||||||||||||||||||||
|
Class 5 |
Very high |
|
||||||||||||||||||||||||||
Concentrations of arsenic reach a “very high” level of pollution in the different time spans over the entire area of the bay. Ferromanganese concretions, widespread in the eastern Gulf of Finland, tend to absorb chemical elements such as arsenic [8]. As stated by ref. [8] the coefficient of concentration of arsenic in ferromanganese nodules can reach 31.2, which exceeds the geochemical background of the territory more than 30 times. This feature explains elevated values of As in sediments. A similar trend is observed for Cu. In the last years of monitoring, the concentrations of Pb and Cr decreased in all basins (except “Berezovy”), reaching the lowest levels of pollution, according to SEPA.
IV. Conclusions
Based on the investigation of the distribution of heavy metals in the bottom sediments of the eastern Gulf of Finland, the following conclusions can be made:
- The concentrations of all studied elements in the surface sediments of the sedimentation basins of the eastern Gulf of Finland exceed pre-industrial levels.
- According to Swedish EPA the most polluted basin is “Berezovy”. Almost all measured values fall in the range from three to five contamination levels.
- When comparing the general distribution pattern in bottom sediments during the pre-industrial epoch and today, it is worth noting that increased concentrations of most studied elements are specific to the northwestern sedimentation basins, whereas reduced levels are distinctive for Neva Bay and the “Koporsky and Luzhsky basins”. This feature is suggested to indicate the difference in the geochemical composition of the sources of incoming material for these sedimentation basins.
- A study of average concentrations in different sedimentation basins in the pre-industrial and modern periods reveals a curtain variation in the distribution trend. Maximal concentrations of Zn, Ni, Co, Cr and V moved south from Vyborg basin to “Berezovy” basin, which points toward a significant anthropogenic load.
- Investigations carried out in the 1990s, indicating that the maximal concentrations of heavy metals prevailed in the eastern part of the Gulf of Finland (Neva Bay and the Kurortny basin), lead us to conclude that the sources of pollution in that period of time were industrial and domestic wastewaters of Saint Petersburg.
- Intense dredging in 2006-2008 caused secondary pollution of waters and deposits with underlying sediments, marked by a drastic increase in the content of heavy metals.
- A trend of improvement of decreasing levels in the content of heavy metals is observed in all sedimentation basins during the last several years.
Acknowledgements. This research was undertaken in the framework of the project of State monitoring of geological environment of the Russian Baltic, White and Barents Seas. The authors thank the captain and the crew of R/V “Risk” and colleagues from the Department of Marine and Environment Geology, who participated in field work – N.B. Malysheva, I.A. Neevin, O.V. Dron. Part of the analytical work was carried out in the Research Park of St. Petersburg State University (project 103-6002).
1. Atlas of geological and geoecological maps of the Russian part of the Baltic Sea. 2010. Ed. Petrov, O.V. SPb.: VSEGEI, 78 p. [Атлас геологических и эколого-геологических карт Российского сектора Балтийского моря. Гл. ред. О. В. Петров. СПб.: ВСЕГЕИ, 2010, 78 с.]
2. Information Bulletin N9. State of geological environment of the continental shelf of the Baltic, White and Barents seas. Sevmorgeo, St.Petersburg, 2007. 55 p. [Информационный бюллетень N9 о состоянии геологической среды прибрежно-шельфовых зон Баренцева, Белого и Балтийского морей. Севморгео, Санкт-Петербург, 2007. 55 с.]
3. Information Bulletin N10. State of geological environment of the coastal zone of the Barents, White and Baltic seas. Sevmorgeo, St.Petersburg, 2008. 51 p. [Информационный бюллетень N10 о состоянии геологической среды прибрежно-шельфовых зон Баренцева, Белого и Балтийского морей. Севморгео, Санкт-Петербург, 2008. 51 с.]
4. Information Bulletin N11. State of geological environment of the coastal zone of the Barents, White and Baltic seas. Sevmorgeo, St.Petersburg, 2009. 58 p. [Информационный бюллетень N11 о состоянии геологической среды прибрежно-шельфовых зон Баренцева, Белого и Балтийского морей. Севморгео, Санкт-Петербург, 2009. 58 с.]
5. Information Bulletin. State of geological environment of the coastal zone of the Barents, White and Baltic seas 2011. Ed. Petrov, O.V., Lygin A.M., SPb.: VSEGEI, 2012. 80 p. [Информационный бюллетень о состоянии геологической среды прибрежно-шельфовых зон Баренцева, Белого и Балтийского морей в 2011 г. /Под ред. О.В.Петрова, А.М.Лыгина. СПб.: Картографическая фабрика ВСЕГЕИ, 2012. 80 с.]
6. Information Bulletin. State of geological environment of the coastal zone of the Barents, White and Baltic seas 2012. Ed. Petrov, O.V., Lygin A.M., SPb.: VSEGEI, 2013. 112 p. [Информационный бюллетень о состоянии геологической среды прибрежно-шельфовых зон Баренцева, Белого и Балтийского морей в 2012 г. /Под ред. О.В.Петрова, А.М.Лыгина. СПб.: Картографическая фабрика ВСЕГЕИ, 2013. 112 с.]
7. Information Bulletin. State of geological environment of the coastal zone of the Barents, White and Baltic seas in 2013. Ed. Petrov, O.V., Lygin A.M., SPb.: VSEGEI, 2014. 136 p. [Информационный бюллетень о состоянии геологической среды прибрежно-шельфовых зон Баренцева, Белого и Балтийского морей в 2013 г. /Под ред. О.В.Петрова, А.М.Лыгина. СПб.: Картографическая фабрика ВСЕГЕИ, 2014. 136 с.]
8. Grigoriev A.G., Zhamoida V.A., Comparison of the sorption properties of the shelf (Gulf of Finland) and oceanic ferromanganese concretions// Ocean and marine geology: Materials of XVIII International Conference on Marine Geology V. II 2009, 258-262 pp. [Григорьев А. Г., Жамойда В. А. Сопоставление сорбционных свойств шельфовых (Финский залив) и океанических железомарганцевых конкреций // Геология морей и океанов: Материалы XVIII Международной научной конференции (Школы) по морской геологии, Т. II, 2009, с. 258-262.]
9. Rybalko A.T., Fedorova N.K., Fokin D.P., et al, Change in geochemical structure of bottom sediments in the eastern Gulf of Finland and it’s bays under elevated anthropogenic load from 2005 to 2009. // XI International ecological forum “Baltic Sea day”, SPb: Maxi-Print, 2010, pp. 186-187. [Рыбалко А.Е., Федорова Н.К. Фокин Д.П. и др. Изменение геохимической структуры донных отложений восточной части Финского залива и его губ под воздействием возросшего антропогенного воздействия за период с 2005 по 2009 г.г. // XI Международный экологический форум «День Балтийского моря». Сборник материалов. СПб ООО «Макси-Принт», 2010. с.186-187]
10. Rybalko A.T., Spiridonov M.A., Opekunov A.Y. et al Lithological and geochemical characteristics of bottom sediments // Gulf of Finland under anthropogenic load, SPb: RAN INOZ, 1999 [Рыбалко А.Е., Спиридонов М.А., Опекунов А.Ю. и др. Литолого-геохимическая характеристика донных осадков //Финский залив в условиях антропогенного воздействия. СПб, РАН ИНОЗ, 1999.]
11. Ryabchuk D., Vallius H.,Malysheva N., Kotilainen A., Zhamoida V., Sukhacheva L. Sedimentation processes and pollution history of the Neva Bay (Eastern Gulf of Finland, the Baltic Sea). // Saint-Petersburg, April 2015, 16 pp. in press
12. SEPA. 2000. Report 5052: Environmental Quality Criteria. Coasts and Seas, Swedish Environmental Protection Agency, Stockholm, Sweden 138 pp.
13. Spiridonov M.A., Rybalko A.T., Moskalenko P.E., Zhamoida V.A., Kotilainen A.T., Winterhalter B. Sedimentation in Eastern Gulf of Finland. Methods of investigations and some results from the Marine Geological Patrole (MEP) cruises // Proc. of the Final Seminar of the Gulf of Finland Year, Helsinki, 1997 p.p. 106-112
14. Vallius H. Recent sediment of the Gulf of Finland: An environment affected by the accumulation of heavy metals, Abo Akademi University, 1999, ____ p.
15. Vallius H., Ryabchuk D., Kotilainen A., Spiridonov M., Suslov G., Zhamoida V. Pollution history of thr Neva Bay since the foundation of the city of St. Petersburg (1703 AD) // The Baltic Sea geology: The Ninth Marine Geological Conference. Extended abstracts. University of Latvia, Riga, 2006, pp. 115-116.
16. Vallius H., Ryabchuk D., Zhamoida V., Grigoriev A., Alliksaar T., Suuroja S. Changes in heavy metal chemistry of the sediments of the Gulf of Finland during the last two decades // Journal of Marine Systems, in press.
