


BISAC NAT010000 Ecology
BISAC NAT045050 Ecosystems & Habitats / Coastal Regions & Shorelines
BISAC NAT025000 Ecosystems & Habitats / Oceans & Seas
BISAC NAT045030 Ecosystems & Habitats / Polar Regions
BISAC SCI081000 Earth Sciences / Hydrology
BISAC SCI092000 Global Warming & Climate Change
BISAC SCI020000 Life Sciences / Ecology
BISAC SCI039000 Life Sciences / Marine Biology
BISAC SOC053000 Regional Studies
BISAC TEC060000 Marine & Naval
This paper presents an initial analysis of the technical viability, of the application for the commercial and pre-commercial wave energy technologies, to the Spanish coasts. This analysis provides an optimal framework for future research, choosing one technology and considering a concrete point of the Spanish coast, with their respective constraints such as, the regulatory aspect of the fees to be applied to such technology, and the restrictions related to the protection of the ecosystems, and other local activities not compatible with the technology.This work is continuing the initiative started by the Project Enola. Enola is a software that provides comprehensive and complete information, about the potential electric production, based on wave energy of the Spanish coast. After evaluating all the wave energy technologies available at this point, those more mature and viable have been selected; the parameters under which they are productive have been analysed; and the ideal areas for implementation on the Spanish coast have been determined, according to the potentials provided by Enola and the technical limitations of the technologies themselves. The results is a summary document where one can easily identify the best locations for the deployment of wave power plants (optimum output).
Wave energy technologies, Enola, Spanish wave atlas.
I. Introduction
The wave energy technologies are based on exploiting the oscillatory phenomena, provided by sea waves. Basically: the horizontal push of the wave, the height variation in the surface of water, and pressure change under the water surface.
An exhaustive analysis of all the existing technologies has been undertaken; to this end, the documentation supporting patents in their original countries, and the papers published on this topic, have been analyzed.
The exploitation of wave energy is an area relatively new where technologies are under constant re-evaluation; with constant, fast evolving research, it is not easy to draw clear conclusions as to how each of them will perform in a given situation.
The objective of this research, is to obtain places of viable implantation in the Spanish coast, of the most matures wave energy technologies. A meticulous selection has been carried out based on above sources, and an objective analysis of the data available, as to narrow down the selection to three alternatives, which have been subjected to an individual analysis of potential performance by geographic area.
Another key component of this study is the Enola [1] application itself. Enola runs on Google Earth [2], and provides a map of the potential wave energy of the Spanish Coast, built by the Instituto de Hidraúlica Ambiental de la Universidad de Cantabria, commissioned and sponsored by (IDAE).
This potential energy map includes a high-resolution, spatial characterization of the energy flows, amount and direction. The unit is shown in KiloWatts /metre of wave front length (from here on kW/m). This characterization is also presented from its time dimension perspective, presenting the variations on a month, season, annual or cross annual bases. Data is presented in the form of maps along the Spanish coast, with area reticles, and 1000 summary points at depths of 20, 50 or 100 meters, as well as some at undefined depths.
Enola is a public application available at http://www.enola.ihcantabria.com.
II. Methodology
A. Technology selection
The list of applicable technologies available has been narrowed down to those that show higher implementation potential. To this end, the following criterion have been applied:
- Portability. Technologies that minimize the need to build an infrastructure on a given location, limiting their usability to that particular area. Only technologies off shore have been considered.
- Maturity. Those technologies that can show actual, verified results.
- Availability. Technologies that are available in the market, or in the process of being made available in the near future.
Based on this criterion, three options have been selected:
1.- Power Buoy (APB 350) [3]. The System is based on below surface buoys that contain a piston that is moved up and down by the pressure variation on the buoy itself caused by the passage of the wave. The piston action compresses a fluid that makes a hydraulic engine rotate, thus moving a generator.
2.Pelamis (P2-002)[4]. Based on the relative movement between elements of the system, produced by the waves. This movement drives a hydraulic system, coupled to an electric generator.
3.Wave Dragon (WD) [5]. Similar to a traditional turbine on a floating platform. The turbine being activated by the falling wave. It's a one-step converter.
B. Technology performance data gathering
The performance data has been gathered by comparing published papers on prototype performance, and those provided by the manufacturers. In the case of APB 350, we've also used actual data from the current installation in New Jersey [6]
All the parameters for the selected technologies are shown in Table 1.
TABLE I. Summary of key operating parameters of the selected technologies
|
|
PELAMIS P2-002 |
WAVE DRAGON |
POWER BUOY APB 350 |
|
Power (Kw/m) |
20-25 [4] |
24-36 [8] |
Fall 16-20 [6] |
|
Winter 20-30 [6] |
|||
|
Spring 16-20 [6] |
|||
|
Significant wave height (m) |
<6-7 [4] |
>5 [8] |
1,5-7 [6] |
|
Depth (m) |
50-60 [4] |
>25 [8] |
40-70 [9] |
|
Distance to shore (Km) |
5-10 [4] |
< 10 [8] |
3-6 [9] |
A. Data gathering for the potential areas of application Equations
1) Significant wave height
One of the critical facts for the technologies to perform appropriately is the significant wave height (from here on HS). This data has been pulled from the annual series tracked by Puntos Simar [7], of Red de Puertos del Estado, which are a network of registration points of surf conditions. The series have been evaluated independently for each of the seasons, and an average height based on values from the last ten years, has been computed.
2) Bathymetry
Google Earth was used as the source, due to a lack of available bathymetry the subject areas of the study. With Google Earth providing the depth of the ocean floor at any given point by moving the cursor, two maps were built for the 50m and 60m strips, respectively, the optimal range for Pelamis.
B. Selection of deployment areas
The main focus of this research, is to enable Enola as a tool to determine areas where these technologies could be deployed. Thus the first parameter to be considered is the wave potential. These potential has been pulled by season, with each season analyzed separately.
Once the wave potential has been determined and crosschecked with the operating parameters of the technologies selected (as to determine the best areas for each of them to be deployed), a second, more restrictive parameter has been applied:
For Pelamis, the range of operation is limited to the 50m to 60m strip [4]. This is the more restrictive parameter. Once the bathymetry map is completed, the wave potential images from ENOLA are captured, formatted to an image file that Google Earth can recognize, and added to each area on layers. The combination of wave potential and bathymetry, providing the areas where this technology could be successfully implemented.
For APB 350 and WD, the second parameter to consider is the significant wave height. APB 350 has an exponential decrease of productivity, when this parameter is below 2.5 m [9]. WD reduces it nominal output up to 1/8 [10], if the parameter is below this 2.5 m point. Thus all locations with an average height of less than 2.5 m of HS, for each season, have been discarded.
It must be noted that this study provides a view of the best possible general areas for a productive implementation. Yet, any particular implementation will require a detailed analysis to determine the ideal point of implementation within the area, considering the specific technology and all the parameters provided by the manufacturer.
C. Coast zoning
The coast has been divided in manageable sections for data analysis. These sections have been defined based on either proximity to an important populated area, or based on areas where surf conditions change. We have obtained 36 study areas of the Spanish coast, over 8 provinces.
I. Focus analysis of areas of potential application
D. Initial preselection of areas
A preliminary analysis, based on the information provided by Enola, shows that there is not a single point on either the Mediterranean or the South Atlantic areas of the Spanish coast, that reaches the minimum levels of potential wave energy required, for a productive exploitation, in any season. Based on the same data, the areas with enough potential are limited to the Canary Islands, and the coasts of Galicia and of the Cantabrian Sea.
There have been testing prototypes in the Mediterranean Sea, as WaveCat [11], but our study focuses on the three most commercially mature technologies, and none of them are operating in the Mediterranean coast.
E. Analysis
- Introduction
The performance of each preselected technology has been analysed for the four seasons of the year, in each of the 36 sections, in which the coast has been divided for the study. Below an example of the process followed for each of the technologies. Note that due to their length, it's not possible to show the individual results of each analysis performed in this paper, although all the summary results are included, below.
- Power Buoy (APB350)
Analysis of potential (autumn). Seeking the areas with a minimum potential for APB 350, to operate during fall. This potential is in the 16 to 30 kW/m [6] range.
On figure1, the results show that APB350 could be installed on the littorals of A Coruña, on the strip from Muros to Fisterra. On figure 2, we observe that the littoral in the areas of Malpica and A Coruña city, is appropriate. Figure 3 shows that there another area with enough potential around Ortigueira.

Fig. 1 Analysis of potential Finisterre area. (Own preparation based on [1] and [2].)
Significant wave height (autumn). Fisterra provides a significant wave height over the predefined limit of 2.5 m, making it a valid area (reference PS 441043071[7]). In A Coruña city (reference PS 441046074[7]) the values for fall are around 3 m, making it another suitable zone. Further north in the area around Ortigueira (reference PS 44 1047075 [7]) values are between 2.5m and 3.0 m, making it equally suitable.
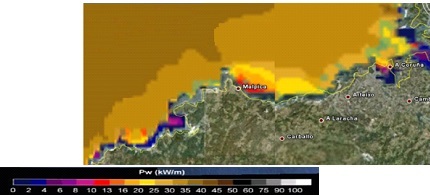
Fig. 2 Analysis of potential Malpica and A Coruña area. (Own preparation based on [1] and [2].)
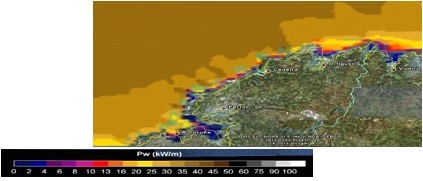
Fig. 3 Analysis of potential Ortigueira area. (Own preparation based on [1] and [2].)
- Pelamis
Analysis of potential (winter). The threshold potential for Pelamis, is in the 20 kW/m to 25 kW/m [4]. In this particular case, the analysis was carried out on the littoral of La Gomera Island, of the Canary Islands. On Figure 4, it is shown that there is a wide area on the north of the island with the appropriate potential.
Analysis of working depths. The bathymetric maps previously built are superposed to the areas of potential. Figure 5 shows the areas suitable for the technology between the red line, depth 60m and green line, depth 50m. The superimposition shows the areas suitable for installation.
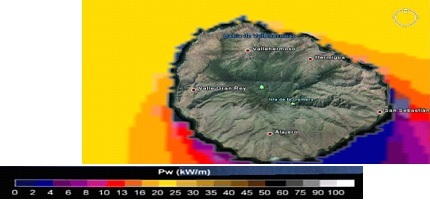
Fig. 4 Analysis of potential La Gomera area. (Own preparation based on [1] and [2].)
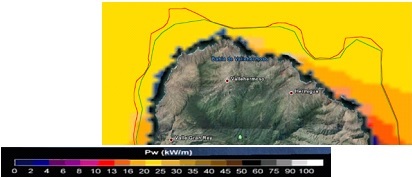
Fig. 5 Bathymetry, depths 50m and 60 m. (Own preparation based on [1] and [2].)
- Wave Dragon
Analysis of potential (spring). The range for WD to operate, is between 24 kW/m and 36 kW/m [8]. The whole coast of Asturias, shows spring potentials appropriate for installation as shown on Figures 6, 7 and 8.
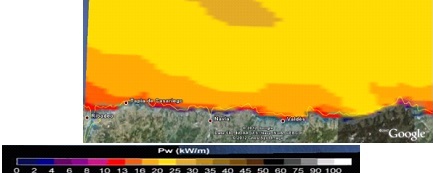
Fig. 6 Analysis of potential from Ribadeo to Valdés (Own preparation based on [1] and [2].)
Analysis of Significant wave height (spring).The strip from Ribadeo to Valdés, reference PS 441054075 [7] does not provide values high enough except for one year, making it an area not suitable for installation. The same applies to the area around Aviles, reference PS 441056075 [7], where the minimum required of 2.5 m can't be reached makes another area not suitable for installation. Same applies to the area around Gijon. In Llanes, reference PS 44 1061074 [7] the values are appropriate thus the area is considered suitable.
I. Results Summary
Figure 7 shows a summary of the results obtained with this approach. Rows show the defined locations for the purposed of the study. They are grouped by province, starting on the Portuguese border, and continuing towards the French border. Then the Canary Islands.
Let us keep in mind that the Mediterranean and south coasts were discarded since they did not reach the minimum potentials required. Columns show the selected technologies. The cells show the location where a technology could be installed.
The season`s initials (“S”, Spring. “A”, Autum. “W”, Winter) indicate those seasons suitable for the technology. If none is appropriate, the cell shows an
“X”. Note that none of the combinations is suitable for summer operation.
II. Conclusions
The Summary of the applicability shows that there are a number of points in the Spanish Coast, well suited for the installation of the most matures wave energy technologies (APB350, Wave Dragon and PELAMIS P2-002)
This study shows what technologies are better suited for installation in specific locations, in what seasons.
A Coruña is the province that shows better conditions for the installation of APB350 and WD, and, due to its high population density, it is a preferred location for the exploitation of wave energy.
As or the existing technologies, and after analysing the current capabilities, we must conclude that there are very few that could be seriously considered for actual installation, and that the path to improve them is still long.
Several groups are focused on researching and developing these technologies, and this means that there is still little transparency as to the technical details behind them.
Based on the values gathered, APB 350 is the most applicable technology, due to its easiness to install. It also has the advantage that the installed power can be easily modified based on the number of buoys installed.
It is also recalled, that other authors have presented in divers publications like [12], that the investment in research and development in this field, must to be important, and the economic return on these investments is still distant.

Fig. 7 Summary of the applicability. Example :  in the Fisterra area, the APB 350, could be installed, and is operational in autumn, winter and spring Fig.4a Analysis of potential from Ribadeo to Valdés (Own preparation based on [1] and [2].)
1. 2016) IDAE website. Available: http://www.enola.ihcantabria.com/
2. (2016) Google Earth website. Available: http://www.google.com/earth/
3. Kathleen A. Edwards, Mike M. Mekhiche Ocean Power Technologies PowerBuoy®: System-level Design, Development and Validation Methodology Proceedings of the 2nd Marine Energy Technology Symposium (April 2014)
4. (2016) Pelamis Wave Power Ltd. website. Available: http://www.pelamiswave.com/reports-papers/
5. Christensen L., Friis -Madsen E., Kofoed J. P., “The wave energy challenge the wave dragon case”. Power Gen Europe conference, paper 4, p. 57.
6. Kate Edwards , Mike Mekhiche “Ocean Testing of a Wave-Capturing Power Buoy” Global Marine Renewable Energy Conference (GMREC) paper 2.51, p.
7. Puntos Simar (2016) Red de Puertos del Estado homepage. [Online]. Available: http://www.puertos.es/oceanografia_y_meteorologia/banco_de_datos/index.html
8. Frigaarda P., Tedda J., Kofoeda J.P., Friis-Madsen E.“3 years experience with energy production on the Nissum Bredning Wave Dragon Proto Type” .World Renewable Energy Congress VIII (WREC 2004). , paper 257, p. 78.
9. (2016)OPT website. Available: http://www.oceanpowertechnologies.com
10. Christensen L., Friis-Madsen E., J.P. Kofoed, Tedd J. “Worlds largest wave energy project 2007 in Wales PowerGen 2006 Europe conference (2006)
11. Fernandez H. , G. Iglesias, R. Carballo a, A. Castro , J.A. Fraguela ,F. Taveira-Pinto, M. Sanchez . “The new wave energy converter WaveCat: Concept and laboratory tests” Marine structures vol. 158 , pp. 25-29, Dec 2012. 2016
12. Mortimer A., R. Veguillas, B. Carruthers, T.Ojanguren. Developing a Business in Marine Renewable Energy. International Conference on Ocean Energy 2012. paper 53, p. 41