


Russian Federation
BISAC NAT010000 Ecology
BISAC NAT045050 Ecosystems & Habitats / Coastal Regions & Shorelines
BISAC NAT025000 Ecosystems & Habitats / Oceans & Seas
BISAC NAT045030 Ecosystems & Habitats / Polar Regions
BISAC SCI081000 Earth Sciences / Hydrology
BISAC SCI092000 Global Warming & Climate Change
BISAC SCI020000 Life Sciences / Ecology
BISAC SCI039000 Life Sciences / Marine Biology
BISAC SOC053000 Regional Studies
BISAC TEC060000 Marine & Naval
The rapid urban development in the Hurghada area since the 1980s has dramatically enhanced the potential impact of human activities. To inventory and monitor this urban development effectively, remote sensing provides a viable source of data from which updated land cover information can be extracted efficiently and cheaply. In this study, data from three satellite datasets, Landsat Thematic Mapper (Landsat 5 TM), Landsat Enhanced Thematic Mapper Plus (Landsat 7 ETM+) and Terra/Advanced Spaceborne Thermal Emission and Reflection Radiometer (ASTER), acquired during 1987, 2000 and 2005, respectively, were used to detect and evaluate Hurghada's urban expansion. Five change detection techniques were tested to detect areas of change. The techniques considered were image differencing, image ratioing, image overlay, multidate principal component analysis (PCA) and post-classification comparison. The post-classification comparison was found to be the most accurate procedure and produced three land use/land cover (LULC) maps of the years 1987, 2000 and 2005 with overall accuracies of 87.8%, 88.9% and 92.0%, respectively. The urban expansion analysis revealed that the built-up area has expanded by 40 km2 in 18 years (1987–2005). In addition, 4.5 km2 of landfill/sedimentation was added to the sea as a result of the coastal urban development and tourist activities. The booming coastal tourism and population pressure were considered to be the main factors driving this expansion, and some natural and artificial constraints constrained the physical shape of the city. The expansion is represented by urban fringe development, linear, infill and isolated models. Topography, lithology and structures were also analysed as possible factors that influenced the expansion. The understanding of the spatial and temporal dynamics of Hurghada's urban expansion is the cornerstone for formulating a view about the future urban uses and for making the best use of the limited resources that are available [1]. A Landsat 5 Thematic Mapper (TM) image of 1987 and a Landsat 7 Enhanced Thematic Mapper Plus (ETM+) image of 2000 were used to examine changes in land use/land cover (LULC) around Hurghada, Egypt, and changes in the composition of coral reefs offshore. Prior to coral reef bottom type classification, the radiance values were transformed to depth invariant bottom indices to reduce the effect of the water column. Subsequently, a multi component change detection procedure was applied to these indices to define changes. Preliminary results showed significant changes in LULC during the period 1987–2000 as well as changes in coral reef composition. Direct impacts along the coastline were clearly shown, but it was more difficult to link offshore changes in coral reef composition to indirect impacts of the changing LULC. Further research is needed to explore the effects of the different image processing steps, and to discover possible links between indirect impacts of LULC changes and changes in the coral reef composition [2]. Knowledge and detecting impacts of human activities on the coastal ecosystem is an essential management requirement and also very important for future and proper planning of coastal areas. Moreover, documentation of these impacts can help in increasing public awareness about side effects of unsustainable practices. Analysis of multidate remote sensing data can be used as an effective tool in environmental impact assessment (EIA). Being synoptic and frequent in coverage, multidate data from Landsat and other satellites provide a reference record and bird’s eye viewing to the environmental situation of the coastal ecosystem and the associated habitats. Furthermore, integration of satellite data with field observations and background information can help in decision if a certain activity has caused deterioration to a specific habitat or not. The present paper is an attempt to utilize remote sensing data for assessment impacts of some human activities on the major sensitive habitats of the north western Egyptian Red Sea coastal zone, definitely between Ras Gemsha and Safaga. Through multidate change analysis of Landsat data (TM & ETM+ sensors), it was possible to depict some of the human infringements in the area and to provide, in some cases, exclusive evidences for the damaging effect of some developmental activities [3]. The coastline of Hurghada has experienced considerable environmental stress from tourist and residential recreational activities. Uncontrolled tourist development has already caused substantial damage to inshore reefs and imbalance in the hydrodynamic pattern of the coastal sediments. The objective of this paper is to investigate environmental changes using multitemporal, multispectral satellite data to identify changes at Hurghada caused by anthropogenic influences. Major detected changes include resort beaches, protection structures and landfill areas; these changes are mainly due to human intervention. Two Landsat Thematic Mapper (TM) images acquired in 1984 and 1997 are used for this analysis. The landfill areas formed during this period are calculated at about 2.15 Km2 . Whilst landfill creates new inexpensive land and improves access to the sea for tourists, it is the cause of environmental problems. In addition, land-use/land-cover and beach changes are determined over the 13-year period [4]. The Red Sea coastal zone is characterized by its sensitive, fragile, unique natural resources and habitats. In the Hurghada coastal region, major changes in the tourism industry have taken place in the last few decades. The detection of environmental changes, in a selected site of the Red Sea coastal zone, will be helpful to protect and develop this coastal environment. A methodology for separating natural and man-made changes in satellite images was developed. It was based on the following assumptions: (1) slow changes, which occur within the range of the class reflectance, represent a natural change rather than an anthropogenic one; (2) natural changes tend to be in the same land-use/land-cover class in each date, i.e. slow changes in the reflectance, not leading to changes in the type of land-use/land-cover class from the master image to the destination one; and (3) rapid changes in the reflectance of the Earth's objects are usually related to anthropogenic activities. This technique is used to identify and assess changes along the coast of Hurghada and Ras Abu Soma, the Red Sea. Results indicate serious human impacts and the necessity for control measures and monitoring. Recommendations are presented [5]. The rapid urban development of the Hurghada area began in early 1980 to build villages and huge tourist resorts and this has continued urban development and subsequent land filling and dredging of the shoreline and the destruction of coral so far. These coastal developments have led to an increase in shoreline land filling and dredging. Despite all the environmental laws of the organization to reduce infringement on the shoreline, the abuses are still ongoing. Change detection analysis using remote sensing is a very good tool to monitor the changes condition in urban development and shoreline. Four sensors was used in this study, three of them are, Landsat Multispectral Scanner (Landsat 1 MSS), Landsat Thematic Mapper (Landsat 5 TM), Landsat Enhanced Thematic Mapper Plus (Landsat 7 ETM+) and the another one is SPOT XS 4 (Originally Système Probatoire de l’Observation de la Terre), acquired during 1972, 1984, 1992, 2004 and 2011, respectively, were used to detect and evaluate Hurghada’s urban expansion and shoreline changes. After the images have been geometrically, radio-metrically and atmospherically corrected using ENVI 5.0 software, the digital number was transformed to the reflectance values and the images were ready to change detection process with the integration of geographic information system using Arc GIS 10 software. The results show that changes during the 39 years of the shoreline is 6.29 km2, (5.65 km2 accretion and 0.64 km2 erosion) and urban development is 16.47 km2 the road network is the 8.738 km2.
Shoreline; Urbanization; Multispectral satellite images.
I- INTRODUCTION
The Red Sea is one of the most important repositories of marine biodiversity all over the world. It has an extraordinary range of biological diversity and endemism. It is the habitat of over 1,000 invertebrate species, more than 1200 species of fishes, and 200 soft and hard corals [6]. It has unique marine habitats as coral reefs, mangroves and sea grass beds. They provide key resources for coastal populations: food, shoreline protection and stabilization, and economic benefits from tourism [7]. Red Sea coast is an area that has been targeted and developed for tourism purposes [8].
The Red Sea coastline possesses a significant proportion and considerable range of the coral reefs with about 3800 Km2 of reef area and 1,800 km long [7]. Red Sea tourism is largely dependent on the surrounding environment such as sand and water quality, and especially coral reefs, which are sensitive to tourist activity, with low government control in the area and growth in private investments.
Much has occurred in the past twenty years in development of the tourism industry in Egypt. Various new destinations in Egypt have been promoted for tourism including the Mediterranean coast, the Red Sea coast, the Gulf of Aqaba, Upper Egypt, and the Western Desert area. This diversification of tourism in the country has been undertaken in hope that it will result in an increase in much-needed tourism revenue, economic growth and employment opportunities. Unfortunately, the relationship between tourism and the environment is unbalanced: tourism is environmentally dependent and the environment is vulnerable to the impact of tourism [7]. The growth of coastal urban areas generates a range of threats to the nearby shoreline habitats. Direct physical damage is caused by construction works on harbours, airports and tourist resorts or by mining the reef areas for construction materials.
Hurghada city was originally a small fishing village, and later, in the 1980s became the first tourist resort on the Egyptian Red Sea. It is located at 350 Km south of Suez with its coast extends for about 62 km along the Red Sea [9].
Remote sensing has the potential to provide accurate and timely geospatial information describing changes in urban land cover [10, 11]. The importance of remote sensing was emphasized as a ‘unique view’ of the spatial and temporal dynamics of the processes in urban growth and land use change [12, 13]. Satellite remote-sensing techniques have, therefore, been widely used in detecting and monitoring land cover change at various scales with useful results [14-16]. Recently, remote sensing has been used in combination with geographical information systems (GIS) and global positioning systems (GPS) to assess land cover change more effectively than by remote-sensing data only [17]. The change detection algorithm is essential to detect the chances which occurred, to identify the nature of the change and to determine the areal extent and the spatial pattern of this change [18]. There are two methods for change detection were widely used; image differencing and post-classification comparison [19].
II- METHODS
This section contains a description of the study area, available satellite data, image classification, techniques of satellite images processing, laboratory tests and topographic maps.
II-1 Study area
The study area used in this study is extending from ElGouna to Sahel Hasheesh as can be shown in “Fig. 1,”. Approximately 62 km in length and 35 km width with total area of about 1625 km2. The land area is 791 km2 and the water area is 834 km2.
.jpg)
Fig. 1. Satellite image shows the location of the study area.
II-2 Material & Methods
To identify environmental changes on the coast of Hurghada, which are caused by tourism development, different methods are applied. The study area is divided into sub sectors. Soil samples are taken to analyze the characteristics aggregate constitute the beach for each sector. The following laboratory tests were applied in order to determine the characteristics of the seawater quality; temperature, salinity, turbidity, total dissolved soiled, Dissolved Oxygen (DO) and the concentration of hydrogen ions (pH).
Three techniques are used to process the satellite images for years 1972, 1984, 1992, 2002 and 2011. These techniques are image differencing, image rationing and post classification change. The interpretation of images is used to identify the changes of Hurghada coastline. Overlaying satellite images and topographic maps give the current features of the its coastline.
Available satellite data, which was used to detect the urbanization and shoreline changes, is five images; four are Landsat (MSS, TM and ETM+) and the fifth is SPOT XS 4 at years 1972, 1984, 1992, 2004 and 2011 respectively. Seven topographic maps were used with 1:25000 scale. All satellite images has been geo-referenced and geometrically corrected to a WGS 84 datum (World Geographic System) and UTM Projection (Universe Transverse Mercator) with Zone 36 North using ground control points during the field verification using Guno Trimble GPS. This process was completed using ERDAS IMAGINE 10 software with Root Mean Square Error (RMSE) of geometric corrected images; 0.0141(MSS), 0.0059(TM), 0.0045(ETM) and 0.0012(SPOT) respectively. Finally, all images are converted from Digital Number (DN) values to physical unit watts per steradian per square metre (W/m2 sr µm), using the calibration data given in the header file (metadata) of the images.
III- RESULTS
Three parameters are studied and presented in this section to show the effect of Hurghada coastal zone development during the last 40 years. These parameters are shoreline changes, urban changes and roads changes as follows:
III-I Shoreline changes
The status of erosion / accretion of Hurghada shoreline during years 1972 and 2011 is studied and presented in “Fig. 2,”. As can be shown from “Fig. 2,”, the shoreline is quite stable and changes occurred may be due to anthropogenic activities as coastal development.
.jpg)
Fig. 2. The status of erosion/accretion of the Hurghada shoreline between (1972 – 2011)
Rates of Hurghada shoreline changes over the last forty years, which is exposed to two important processes erosion (dredging) and accretion (land filling), are presented in “Fig. 3,”.
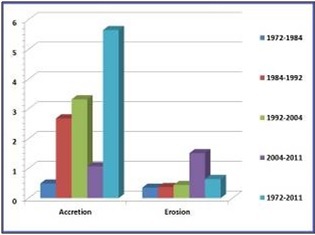
Fig. 3. The change rate of shoreline at Hurghada from years 1972 to 2011.
“Fig. 3,” shows that the accretion rate of shoreline from years 1972 to 1984, 1984 to 1992, 1992 to 2004 and 2004 to 2011 are 0.49, 2.68, 3.32, 1.07 km2 / km length respectively, while the erosion rate for same periods are 0.35, 0.37, 0.44, 1.51 km2/ km length. The total change rate of accretion is +5.65 km2 and the total change rate of erosion is +0.64 km2. It is clear that the period from 1984 to 2004 is the time for revolution tourism industry with accretion rate change +2.68 km2 and erosion rate +0.37 km2.
Examples of dredging and land filling at Hurghada shoreline are presented in “Fig. 4,”. These artificial processes lead to a change in the nature of the shoreline and the biodiversity which inhabiting the coastal area.
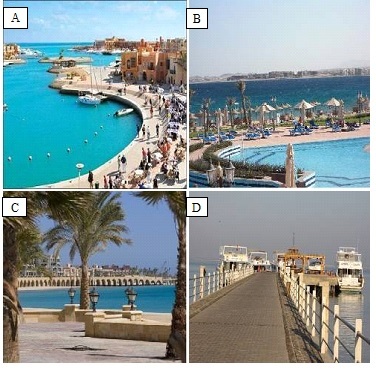
Fig. 4. Examples of dredging and land filling at Hurghada shoreline
A: Dredging & and land filling at El Gouna, B & C: Land filling at Sahl Hasheesh and D: land filling at Magawish.
III-2 Urban Changes
In this section, the urban / tourism development at Hurghada from year 1972 to 2011 is studied as can be shown in “Fig. 5,”. “Fig. 5,” shows that the areas of urbanization are 1.48, 2.65, 6.16, 14.28 and 17.95 km2 for years 1972, 1984, 1992, 2004 and 2011 respectively.
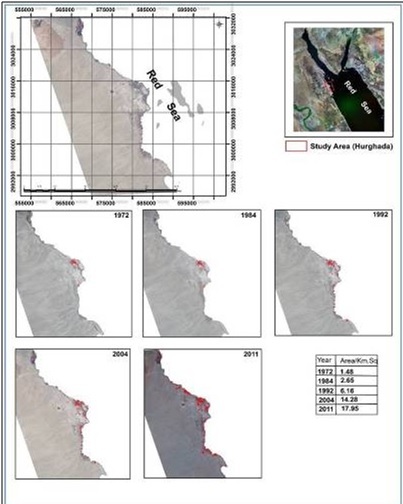
Fig. 5. The status of urbanization development at Hurghada from years 1972 to 2011.
“Fig. 6,” shows that the changes rate of urbanization area are +1.17, +3.51, +8.12 and +3.67 km2 between years 1972, 1984, 1992, 2004 and 2011 respectively. The total urbanization area is +16.47 from years 1972 to 2011.
The same conclusion for the coastline changes is also raised here, that the period from 1984 to 2004 is the time for revolution tourism industry with the maximum increase of urbanization area, +11.63 km2.
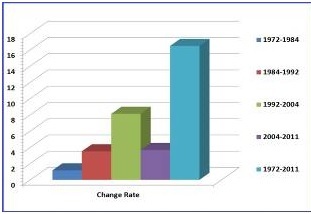
Fig. 6. The change rate of urbanization at Hurghada from year 1972 to year 2011.
III-3 Roads Network Changes
“Fig. 7,” represent the road development at in Hurghada from year 1997 to 2011. It is clearly visualize the vigorous development in this sector to meet the requirement of future tourism industry development.
.jpg)
Fig. 7. Road Development in Hurghada form the years 1972-2011.
Roads area and change rates are represented in “Fig. 8,”. The roads area are increased from 2.012 km2 at 1972 to 10.75 km2 at year 2011 with total change rate +8.738 km2. This explains the beginning of the roads developments at 1984 with change rate about (+1.268 km2).
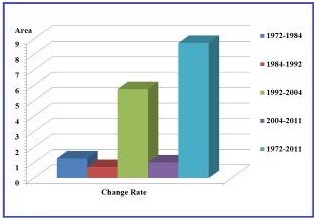
Fig. 8. The change rate of road development from year 1972 to 2011.
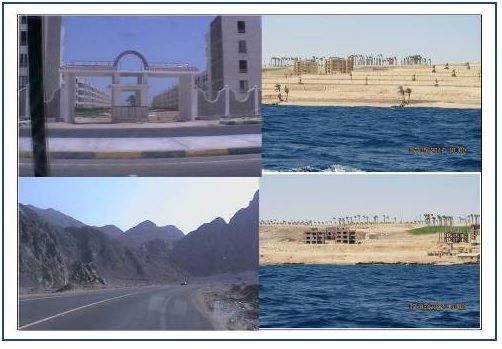
Fig 9: Photos show the roads and urban development's at Hurghada.
IV- DISCUSSION and CONCLUSION
Due to human expansion especially near urban and coastal areas, the coastal zones are usually subjected to a variety of disturbances, which have damaging impacts on the marine habitats. Human activities associated with coastal developments include deforestation, infrastructure development and extension of agricultural developments to marginal lands.
This study aimed to assess shoreline and urbanization changes at Hurghada region from years 1972 to 2011. The present study indicated that total area of accretion (land filling) is 5.65 km2 and 0.64 km2 erosion (dredging) for the last 39 years (1972 to 2011). The shoreline accretion (land filling) between years 1984 to 1992 increased 2.68 km2 and the erosion (dredging) increased 0.37 km2.
Hurghada city has been considered as one of the touristic communities grown rapidly with a planned urban community. So, it became important to have touristic capabilities for monitoring, assessment and control of land use/cover changes for this touristic city. Moreover, the quantitative and qualitative analysis of these changes will certainly provide very important information for the prediction of the future changes which will certainly help for the decision making for economic development and resource management of Hurghada city.
"Ref. [1]" has made change detection map indicating the urban expansion and its spatial patterns in the Hurghada area through years 1987 to 2005 using Landsat (TM, ETM+) and ASTER images. They made the change detection map through 1987, 2000 and 2005 and estimated land filling along the coastline from El-Gouna resort at the north of Hurghada to Sahl Hashish with area 4.5 km2.
"Ref. [2]" has made change detection map indicating the shoreline changes in the same region (Hurghada) through an 13-year period (1987–2000) using Landsat (TM, ETM+). They found the land filling area (accretion) increased 4.0 km2 and the dredging (erosion) increased 2.0 km2 from 1987 to 2000.
"Ref. [3]" calculated the total area subjected to land filling and dredging in the coastal strip from north of Hurghada to south of Safaga between 1984 and 2000. He found that 3.6 km2 was used as land filling (accretion) and 2.9 km2 was used as the dredging (erosion) area.
"Ref. [4]" has made landfill detection for the same area based on two Landsat TM-images of 1984-1997 respectively. He calculated the landfill areas (accretion) to be 2.3 km2.
"Ref. [5]" has made landfill detection for the same area (Hurghada) based on two Landsat TM-images of 1984-1991 respectively. He calculated the land filling (accretion) areas to be 3.95 km2.
Comparison between these previous studies and the preset study is shown in the following table.
Table 1: Comparison between values of shoreline changes in published references and the present study
|
Reference |
Years interval |
Period (years) |
Satellite data used |
Shoreline changes (Km2) |
||
|
L.f. |
D. |
T. |
||||
|
[5] |
1984-1991 |
7 |
TM |
3.95 |
- |
3.95 |
|
[4] |
1984-1997 |
13 |
TM |
2.3 |
- |
2.3 |
|
[3]* |
1984-2000 |
16 |
TM, ETM+ |
3.6 |
2.9 |
6.5 |
|
[2] |
1987-2000 |
13 |
TM, ETM+ |
4.0 |
2.0 |
6.0 |
|
[1] |
1987-2005 |
18 |
TM, ETM+, ASTER |
4.5 |
- |
4.5 |
|
The present study |
1972-2011 |
39 |
MSS, TM, ETM+,SPOT |
5.65 |
0.64 |
6.29 |
L.f. =Land filling, D. = Dredging, T. =Total, (*) indicates to the Hurghada area and Safaga.
Coastal developments have led to an increase in hotels and other major industries, and hence greater population on the coastal margin. One of the major problems encountered by this is the increased disposal of household waste and from sewage (often untreated) to the marine environment.
Concerning urban and road changes of the study area the present investigation indicated that increased of total area for urban is 16.47 km2. [1] has made change detection map indicating the urban expansion and its spatial patterns in the same region (Hurghada) area through years 1987 to 2005 using Landsat (TM, ETM+) and ASTER images. He found the urban area increased from 1987 to 2005 was about 8 to 31.67 km2.
"Ref. [2]" has made change detection map indicating the urban extension and its spatial patterns in the same region (Hurghada) area through an 13-year period (1987–2000). He found the urban area increased from 1987 to 2000 was about 4.9 to 31.1 km2.
"Ref. [4]" has made a landfill detection for the same area based on two Landsat TM-images of 1984-1997 respectively. He calculated the total changes of urban area to be 11.86 km2.
"Ref. [5]" has made a landfill detection for the same area based on two Landsat TM-images of years 1984 and 1991. He calculated the total changes of urban area to be 3.7 km2. This results agree with the same period of the urban changes.
Concerning road network of the study area the present investigation indicated that increased of total area was 8.74 km2 for years 1972 to 2011. The roads area between from year 1984 to year 1992 increased 0.71 km2 while the road area between year 1984 to 2004) increased 6.46 km2.
"Ref. [1]" has made change detection map indicating the road network expansion and its spatial patterns in the same region (Hurghada) area through an 18-year period (1987–2005) using Landsat(TM, ETM+) and ASTER images to make the change detection map through 1987, 2000 and 2005. He found the road area increased from 1987 to 2005 was about 0.12 to 0.26 km2.
"Ref. [2]" has made change detection map indicating the road network extension in the same region (Hurghada) area through an 13-year period (1987–2000). He found the road area increased from 0.12 to 0.25 km2. Table 2 shows a comparison between these previous studies and the preset study.
Table 2: Comparison between values of urban and Road changes in published references and the present study.
|
Author |
Years interval |
Period (years) |
Satellite data used |
Development changes(Km2) |
||
|
U. |
R. |
T. |
||||
|
[5] |
1984-1991 |
7 |
TM |
3.7 |
- |
3.7 |
|
[4] |
1984-1997 |
13 |
TM |
11.9 |
- |
11.9 |
|
[2] |
1987-2000 |
13 |
TM, ETM+ |
26.2 |
0.13 |
26.33 |
|
[1] |
1987-2005 |
18 |
TM, ETM+, ASTER |
31.7 |
0.14 |
31.84 |
|
The present study |
1972-2011 |
39 |
MSS, TM, ETM+,SPOT |
16.5 |
8.74 |
25.24 |
U. =Urban, R. =Road, T. =Total
This difference can be explained as [4] doesn’t make a distinction between land filling / sedimentation and dredging / erosion effects. The differences with our estimates can again be explained by a difference in methodologies.
"Ref. [4]" results are based on image classification, while our estimates are derived from a visual digitalization on screen of the urban area. Notwithstanding the difference estimates for both coastal line changes and expansion of the urban area, the conclusion remains that the urban development has been booming during the last two decades in Hurghada and surroundings and that this altered the coastal line in a dramatic way.
The difference in the urban area and road network area was explained as the authors using the different methodologies and techniques at the research. May be attributed to the different software was used. Finally the different sensor or satellite images was used may be effects on the total accuracy of the area which calculated by different authors.
1. Kamh, S., et al., Evaluating urban land cover change in the Hurghada area, Egypt, by using GIS and remote sensing. International Journal of Remote Sensing, 2012. 33(1): p. 41-68.
2. Vanderstraete, T., R. Goossens, and T. Ghabour, The use of multi-temporal Landsat images for the change detection of the coastal zone near Hurghada, Egypt. International Journal of Remote Sensing, 2006. 27(17): p. 3645-3655.
3. Moufaddal, W., Use of satellite imagery as environmental impact assessment tool: a case study from the NW Egyptian Red Sea coastal zone. Environmental Monitoring and Assessment, 2005. 107(1-3): p. 427-452.
4. Dewidar, K., Landfill detection in Hurghada, North Red Sea, Egypt, using thematic mapper images. International Journal of Remote Sensing, 2002. 23(5): p. 939-948.
5. El-Gamily, H., S. Nasr, and M. El-Raey, An assessment of natural and human-induced changes along Hurghada and Ras Abu Soma coastal area, Red Sea, Egypt. International Journal of Remote Sensing, 2001. 22(15): p. 2999-3014.
6. Lieske, E., K. Fiedler, and R. Myers, Coral Reef Guide: Red Sea to Gulf of Aden, South Oman;[the Definitive Guide to Over 1200 Species of Underwater Life]2004: Collins.
7. Hilmi, N., A. Safa, and S. Reynaud, Coral Reefs and Tourism in Egypt's Red Sea. Topics in Middle Eastern and North African Economies, 2012. 14: p. 416-434.
8. Shaalan, I., Sustainable tourism development in the Red Sea of Egypt: threats and opportunities. Journal of Cleaner Production, 2005. 13(2): p. 83-87.
9. Frihy, O., et al., Human impacts on the coastal zone of Hurghada, northern Red Sea, Egypt. Geo-Marine Letters, 1996. 16(4): p. 324-329.
10. Alberti, M., R. Weeks, and S. Coe, Urban land cover change analysis in Central Puget Sound. Photogrammetric Engineering and Remote Sensing, 2004. 70(9): p. 1043-1052.
11. Chen, X., et al., Remote Sensing Image-Based Analysis of the Relationship Between Urban Heat Island and Land Use/Cover Changes. Remote Sensing of Environment, 2006. 104(2): p. 133-146.
12. Batty, M. and D. Howes. Predicting temporal patterns in urban devel-opment from remote imagery. in Remote sensing and urban analysis. 2001. J. P. Donnay, M. J. Barnsley, & P. A. Longley (Eds), London: Taylor and Francis.
13. Herold, M., H. Couclelis, and K. Clarke, The Role of Spatial Metrics in the Analysis and Modeling of Urban Land Use Change. Computers, Environment and Urban Systems, 2005. 29(4): p. 369-399.
14. Wilson, J., et al., Evaluating Environmental Influences of Zoning in Urban Ecosystems with Remote Sensing. Remote Sensing of Environment, 2003. 86(3): p. 303-321.
15. Mundia, C. and M. Aniya, Analysis of Land Use/Cover Changes and Urban Expansion of Nairobi City using Remote Sensing and GIS. International Journal of Remote Sensing, 2005. 26(13): p. 2831-2849.
16. Shalaby, A. and R. Tateishi, Remote Sensing and GIS for Mapping and Monitoring Land Cover and Land-Use Changes in the Northwestern coastal zone of Egypt. Applied Geography, 2007. 27(1): p. 28-41.
17. Muller, D. and M. Zeller, Land Use Dynamics in the Central Highlands of Vietnam: a Spatial Model Combining Village Survey Data with Satellite Imagery Interpretation. Agricultural Economics, 2002. 27(3): p. 333-354.
18. Macleod, R. and R. Congalton, A Quantitative Comparison of Change-Detection Algorithms for Monitoring Eelgrass from Remotely Sensed Data. Photogrammetric Engineering and Remote Sensing, 1998. 64(3): p. 207-216.
19. Singh, A., Review Article Digital Change Detection Techniques Using Remotely-Sensed Data. International Journal of Remote Sensing, 1989. 10(6): p. 989-1003.