


Russian Federation
BISAC NAT010000 Ecology
BISAC NAT045050 Ecosystems & Habitats / Coastal Regions & Shorelines
BISAC NAT025000 Ecosystems & Habitats / Oceans & Seas
BISAC NAT045030 Ecosystems & Habitats / Polar Regions
BISAC SCI081000 Earth Sciences / Hydrology
BISAC SCI092000 Global Warming & Climate Change
BISAC SCI020000 Life Sciences / Ecology
BISAC SCI039000 Life Sciences / Marine Biology
BISAC SOC053000 Regional Studies
BISAC TEC060000 Marine & Naval
While creating the Black Sea GIS, the primary attention was paid to selecting free and platform independent software capable of providing necessary functionality and to possible extending the system with new data and facilities. To use coastal zone data, a special module was developed. At present, it includes data for the coastline of about 105 km from Magry to Adler. These data were obtained in SB SIO RAS and transferred to MHI data base in framework of their joint activities.
Black Sea GIS, oceanographic database, coastal zone data
The economical land development by mankind is nearly always connected with sea and ocean coasts. It was there that industrial centers were created due to the exceptional transport accessibility. That is why the regional economical and commercial development was based in the coastal zones which possess rich resources and seem to be among the most used and attractive for investments areas in the world economy.
The experience of economical development in the coastal areas allows distinguishing the two main types of spatial organization of the coastal zone economy. One of them is often related to the industrial and commercial specialization, including transport activities. The other type is connected with the recreation and tourism business including conditions for ecological tourism. As a rule, current coastal areas combine both shore and marine zones’ functional loads. The coastal area development should, on the one hand, meet the governmental needs and, on the other hand, contribute to the recovery of natural human habitat.
One of the most efficient means to provide users with various information is application of geoinformation systems (GIS) based on the up-to-date technologies and assuring data and knowledge automated processing and representation.
A significant experience in creating such information systems, providing users with convenient interface to work with data and offering multifaceted functionality, is accumulated in the Department of Marine Information Systems and Technologies. A special software module to access coastal data was developed and included into the GIS to allow typing, holding, and visualizing of information of different types on large-scaled maps.
II. information resources
The main data resources for GIS are as follows:
– Oceanographic data kept in the MHI Oceanographic Data Bank which contains over 160,000 hydrological and about 34,000 hydrochemical stations accomplished since 1890 till 2015;
– Satellite data entering from the MHI Department of Remote-Sensing Methods. They are represented by images obtained from MODIS AQUA satellite in GeoTiff format which contains measured data for three parameters, i.e. sea surface temperature, chlorophyll a concentration, and water leaving radiation;
– Climatic atlas consisting of the following sections: Seawater Temperature, Salinity, Density, Heat Storage, Oxygen Concentration in Seawater, Aerobic Waters Low Boundary Location, and Hydrogen Sulfide Zone Upper Boundary Location. In total, the atlas includes over 400 maps in jpeg and shape formats;
– Social and economic data including population in cities, population density, infrastructure (roads and railways), industrial enterprises etc. The information was mainly taken from websites of state statistics;
– Coastal zone data including data for about 105 km coastline from Magry to Adler. These data were obtained in SB IO RAS and transferred to the MHI database in the framework of their joint activities.
According to the basic data types, the module structure of GIS was developed. Each type of data is matched to a module which allows selection and visualization of the data.
III. Black Sea GIS structure
While creating the Black Sea GIS, the primary attention was paid to selecting free and platform independent software capable of providing necessary functionality.
The software for data access and visualization was developed on the basis of client server architecture. Its server part includes an oceanographic database (ODB), a map service, python and php-modules providing data processing and interaction between server and client applications (Fig. 1).
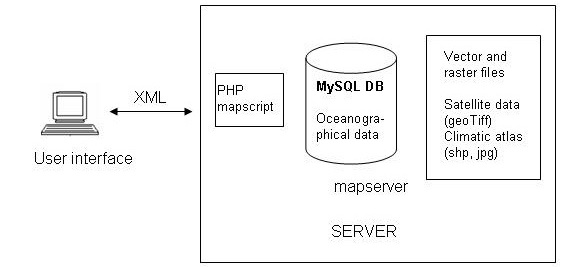
Fig. 1. Black Sea GIS Architecture.
MapServer was chosen to be a map service.
To operate the database, MySQL database management system was selected.
The Black Sea GIS was developed using a module structure that gives excellent capabilities for extending its functionality and integrating new types of data. A special module was developed for each type of data.
The main types of data used are:
1. digital data kept in the database (oceanographic data, coastal zone data);
2. graphical data:
- maps in jpeg format (maps of the Black sea climatic atlas);
- maps in shape format (isolines of the climatic atlas maps, social and economic data);
- maps in GeoTiff format (MODIS satellite data);
- textual data (social and economic information and coastal zone data).
The system includes:
- oceanographic data module realizing import/export of oceanographic data in ODV format; selection of oceanographic data on region, time, season, and cruise; visualization of required oceanographic data (presenting stations on the map, making profiles of oceanographic parameters, metadata and data output);
- module of selecting and visualizing maps of the climatic atlas in jpeg and shape formats;
- module of selecting and displaying MODIS AQUA satellite images in GeoTiff format;
- module of selecting and displaying social and economic data for coastal regions;
- module of selecting and visualizing of coastal zone data;
- module of overlaying various data types.
The functional capabilities of modules and the whole system are described in detail in [1] and [2]. In the paper we will only give an example of selecting and visualizing oceanographic data (Fig. 2) and overlaying the climatic atlas isolines and a satellite image (Fig. 3).
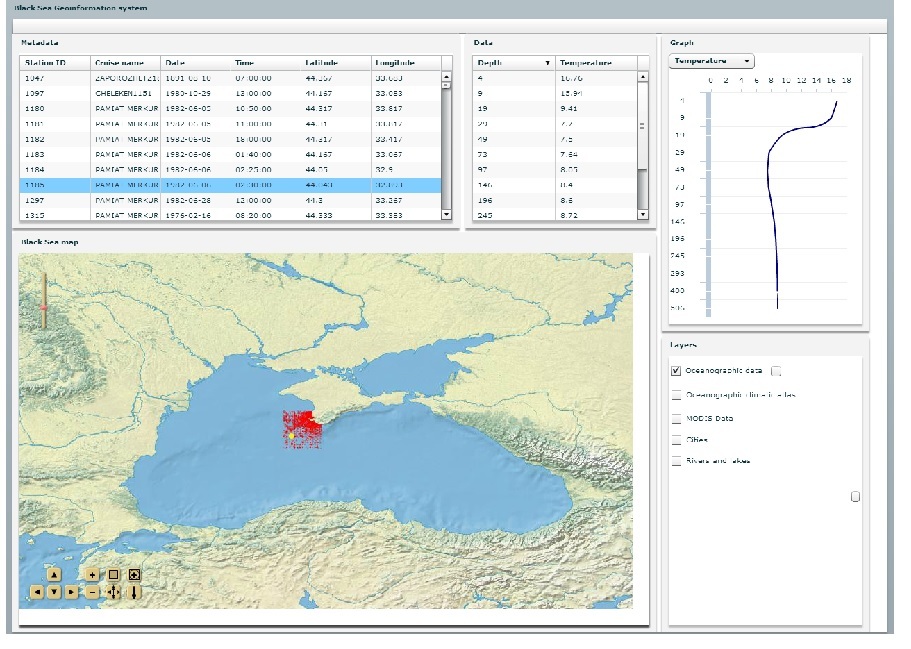
Fig. 2. An example of displaying the result of selecting oceanographic data.
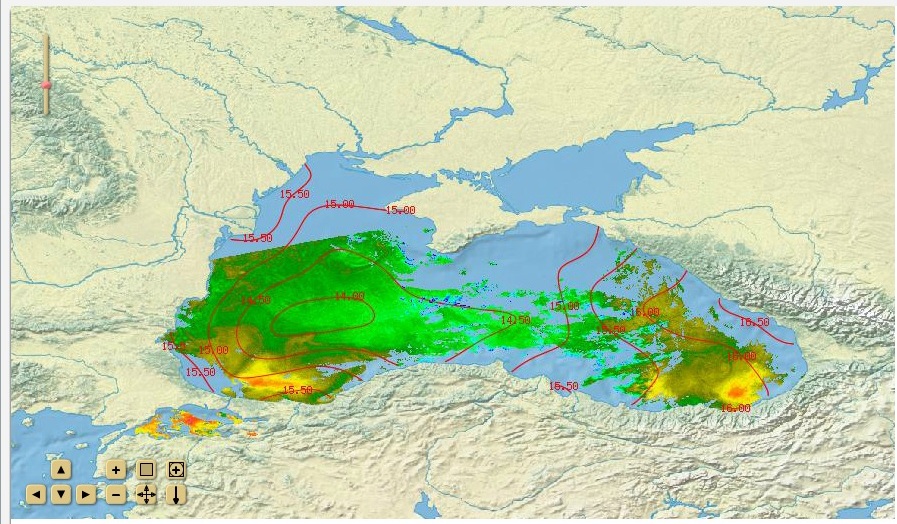
Fig. 3. Overlaying a climatic atlas map and a satellite image.
Due to the module GIS structure it was enough easy to extend facility of the Black Sea GIS with coastal zone data. A special module was developed and gave an opportunity to select, visualize and overlay different type of coastal zone data such as digital data (database), text information (beach descriptions), and images (beach and coastal zone photos). Let us consider these data in more detail.
IV. Coastal zone data
The coastal zone data include textual information and digital data for about 105 km coastline from the settlement of Magry to the settlement of Adler. These data were obtained in SB SIO RAS and transferred to the MHI database in the framework of their joint activities [3, 4].
The given section was divided into 4 regions according to their geomorphological characteristics:
- The northern region from the river Tuapse to the river Shakhe (the settlement of Golovinka) is composed of terrigene carbonate flysch rocks of the Upper Cretaceous;
- The second region from the river Shakhe to the river Psakhe (the settlement of Mamayka) is mainly represented by terrigene subflysch rocks of the Paleocene;
- The coastal section south of the river Psakhe to the river Kudepsta (the settlement of Kudepsta) is composed of molass formation of the Upper Paleogene;
- The Imereti plain which is an estuary of the rivers Mzymta and Psou and is composed of the Quaternary deposits.
In addition to that, the beaches were described and their average widths and sediment flow capacity were determined for the eight coastal segments:
the settlement of Magri – the river Ashe;
the river Ashe – the river Psezuapse;
the river Psezuapse – the river Shakhe;
the river Shakhe – the river Sochi;
the river Sochi – the river Bzugu;
the river Bzugu – the river Kudepsta;
the river Kudepsta – the river Mzymta;
the river Mzymta – the river Psou.
A coastal database was worked out to arrange and visualize the obtained measurements. The database includes the following characteristics for each of the eight segments:
- average width of the beach;
- coastline length for a beach of each width;
- calculated capacity of alongshore sediment flow;
- description of coast protection constructions;
- description of beach dynamics;
- artwork (photographs of coast, coast protection constructions, etc.).
A table including geomorphological characteristics (composition of rocks, rock formation, etc.) for the four selected segments was created in the data base.
All these data have been integrated into the Black Sea GIS. It gives opportunity to select each part of the coast and display their characteristics and descriptions. The Fig. 4 presents description of coastal zone from Magri to the Ashe river.
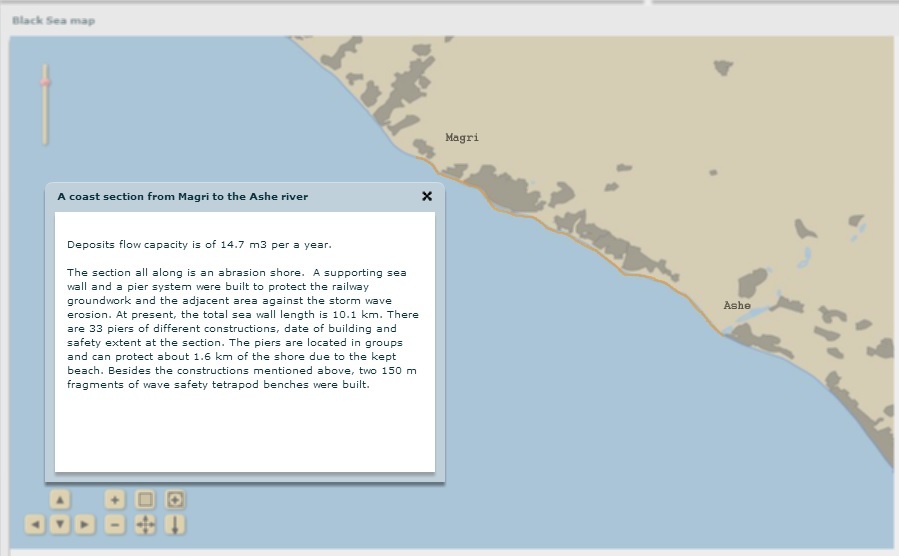
Fig. 4. Description of the coast section from Magri to the Ashe river
V. Conclusions
The accomplished research showed possibility and practical expediency of the GIS development using free software and MapServer as a map service.
The openness of the Black Sea GIS architecture gives excellent capabilities for extending its functionality, using new data sources and connecting new databases. At present, the work on improving the Black Sea GIS is continued.
1. E. Zhuk, A. Khaliulin, A. Ingerov, E. Godin, “The experience of Black Sea GIS developing at base of free software, ” Geoprofi, vol. 2, pp. 36-39, April 2016.
2. A.Kh. Khaliulin, E.A. Godin, A.V. Ingerov, E.V. Zhuk, L.K. Galkovskaya, E.A. Isaeva, “Ocean data bank of Marine Hydrophysical Institute: information resources to support re-search in the Black sea coastal zone,” in Ecological Safety of Coastal and Shelf Zones of Sea, Se-vastopol: EKOSI-Gidrofizika, vol. 1, 2016, pp. 88-94 [in Russian].
3. R. Kosyan, M. Krylenko, B. Chubarenko, D. Ryabchuk, “Russian coasts of European seas, ” Coastal erosion and protection in Europe (ed. Pranzini E. And Williams A.) UK, Earthscan, pp. 9-30, 2013.
4. M. Krylenko, “Monitoring researchers of the Black Sea coast dynamics (Krasnodar region, Russia)," Proc. Of the PERSEUS Training Courses/Summer School "Challenge for good environmental status in coastal waters" and 3-rd International Seminar "Dynamics of the coastal zone in the non-tidal seas/ Edited by Divinsky B.V., Kosyan R.D., Silvestrova K.P., Zatsepin A.G, Gelendzhik, pp. 18-23, 2014.