


BISAC NAT010000 Ecology
BISAC NAT045050 Ecosystems & Habitats / Coastal Regions & Shorelines
BISAC NAT025000 Ecosystems & Habitats / Oceans & Seas
BISAC NAT045030 Ecosystems & Habitats / Polar Regions
BISAC SCI081000 Earth Sciences / Hydrology
BISAC SCI092000 Global Warming & Climate Change
BISAC SCI020000 Life Sciences / Ecology
BISAC SCI039000 Life Sciences / Marine Biology
BISAC SOC053000 Regional Studies
BISAC TEC060000 Marine & Naval
The problems related to impact of the expected climate change and hydrological response assessment for the coastal zones of the Russian Arctic are discussed. The study presents the approach, which allows to perform climate-based forecasting of multi-year river runoff in form of probability density function (pdf) using theoretical distributions from K. Pearson's family. The advantage and limitation of the hydrological model allowing to predict the statistical characteristics of multi-year runoff, without producing projected time hydrological time series are discussed. The regional scale assessment of the multi-year the statistical characteristics of the spring flood peak runoff is evaluated using the climate projections from CMIP5 dataset as suggested by the Intergovernmental Panel on Climate Change (IPCC). The alarm regions, where the socio-economical infrastructure and coastal systems have to be adapted to the expected climate are distinguished.
long-term river runoff, coastal regions of the Russian Arctic, climate change, fractal analysis of multi-year time series of hydro meteorological variables, extension of phase space of predictive models.
I. Challenge and decisions: paths to solve the problem
The issues concerning to the climate change afterwards for economy have been discussed during last two decades. Sustainable development of industry and social infrastructure requires the different types of resources including financial and human as well as natural, and the water resource in particular. For water-dependent industries, the water resource requirement can be formulated as functions, which include the specific hydrological values usually presented in terms of probability. For long-term water management, the levels or discharges with required probability of exceedance are needed to perform the risks analysis for the existing hydraulic constructions or to design future socio-economic infrastructure. Also, the parameters of ejections of the multi-year runoff (frequency and duration time) are also important in the decision making connected with effective production of hydropower plants or for environmental tasks.
To estimate the hydrological values in terms of probability, the following long-term statistical characteristics are needed: mean value, the coefficients of variation (Cv) and skewness (Cs). These values are estimated from the observed multi-year time series of river runoff (annual, minimal and maximal). Then, the hydrological detrimental events used in the engineering practice (e.g. to design hydraulic constructions) are calculated. Usually such engineering calculations are regulated by the National Guidelines [1, 21]. The guidelines prescribe the standard procedure to calculate the hydrological values with required probability of exceedance, however these methods do not allow including the future climate projections. However, past frequency and magnitude of extreme flood events do not provide correct estimations for future in changing climate.
Therefore, the methods and tools allowing to long-term forecasting of the hydrological characteristics in terms of probability based on the climate projections are required, especially to provide a regional scale assessment, which is most important for the management planning purposes. The study aims to develop the method allowing to produce the climate-based forecast of the long-term hydrological values in terms of probability, and performs the regional scale assessment of the statistical values of the multi-year maximal runoff for the territories of the Russian Arctic in its coastal zones.
Nowadays, there are four different approaches to perform the hydrological response to the expected climate changes. The first approach uses the correlation theory to establish statistical relationship between runoff and climate variables (mean annual rainfall and air temperature). This approach is widely applied due to its simplicity, e.g. Vinikov [22] with reference to Groisman [4] suggested the “linear relationship between the annual runoff of the rivers located on the territory of the USSR, and the change in the mean values of the annual surface air temperature in the northern hemisphere (17.5–87.5 n. l.)”. These relationships allow to define the general trends in the runoff change (see p. 193 in [23]), and perform a kind of hydrological scenarios, which predict only runoff mean values and do not allow estimating the values with required probability of exceedance.
The second approach based on the water balance. The hydrological balance model allows to assess the mean values of the long-term annual runoff based on the future climatology [18, 19] and provides the long-term of the change in multi-year mean values for the annual runoff in a regional scale (see e.g. map in the Fig. 3.1, p. 140 [20]). However, the mean value itself does not allow to produce the forecast of the hydrological values with required probability of exceedance, which are used in engineering calculations. The values of coefficients of variation and skewness (Cv, Cs) are also needed to obtain the hydrological values in terms of probability, and to apply these values for the long-term managements planning for water-dependent industries.
The third approach used the equations describing the physical processes on the watershed (snow melting, percolation, soil water freezing/melting, evaporation), and theory of stochastic processes. These hydrological models include two components: the physically-based dynamic core model and (2) the stochastic components usually presented by weather generator [3]. Such models allow to simulate the synthetic runoff based on meteorological time series, and used for a short-term forecasting (the dynamical core of the model) with daily or hourly time steps. The stochastic part of the model allows performing the runoff uncertainties and to provide the forecast in form of probability distribution (see p. 209, 210 [3]). However, the physically-based stochastic modelling is computationally cost (about 19 hours of computer time are required to calculate one day for particular catchment (see p. 209 [3]).
Thus, the hydrological forecast using such kind of the models is able to perform only in catchment scale for the particular watershed and usually used for operational practice. To provide regional scale climate-based assessment one has run the model for a set of watersheds (e.g. in the Russian Arctic there are several hundred of them), and the calculations using the projected climatology produced at least by one general atmospheric circulation model (GCM) are very expensive computationally. However, the method of the model validation against observed data has to be developed based on two time periods with different climate and hydrological regime to proof the "freezing" of the numerous model parameters. This step is vital for the models with calibration procedure embedded into parameterization scheme, when the numerical values of the model parameters are calculated based on the past climatology and used to evaluate forecast for future climate.
Further more, it should be mentioned that the climate scenarios distributed by IPCC have also the political component, and the authors of the climate change reports suggested to use the climate projections represented as multi-year mean values for the period of 20–30 years instead of the daily meteorological data.
However, the key issue in applying of physically-based models with stochastic components to perform the climate based hydrological probabilistic forecast is following: the exceedance probability curves of the spring flood runoff obtained using this model provides the distribution curve of the Pearson type III (see p. 243 [3]), which is well approximated by the empirical points and that provides a measure of the validity of the hydrological model applied. Then, the question is: why the physically-based model should be used as a dynamical core if the model of linear filter (in form of ordinary differential equation of the first order) with stochastic components added to climate forcing and physiography parameter give the same result? In other words, instead of complex multi-parameters hydrological model, the simple model with two parameters (runoff coefficient and relaxation time) allow to perform the probability distributions from K. Pearson family.
The fourth approach is based on the theory of Markov processes, and is discussed in detail further. The approach was suggested about 25 years ago in the Russian Hydrometeorological University, and the stochastic hydrological model have been developed and tested as part of education courses for hydrologists [11, 12].
II. Basic concept: model and its limitations
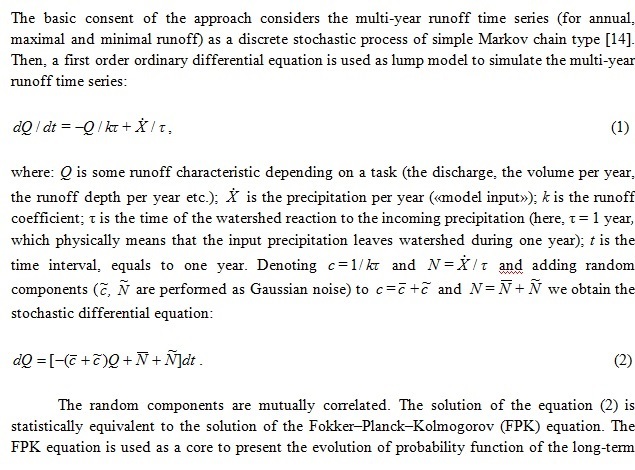
where A, B – are drift and diffusion coefficients (see the equations in [12]), M[...] – is a mathematical expectation; and n – is an order of the statistical moment.
The algorithm to apply of this model to assess the hydrological response to the expected climate change in a regional scale includes two stages: the first is the model parameterization using the maps of multi-year runoff mean value, coefficient of variation and coefficient of skewness (i.e. the annex to the SNIP 2.01.14-83 [20]). The map was obtained using observed time series without the statistically significant trends up to 1980s. On second stage, the projected climatology is used to force the model and the projected statistical moments are obtained and used to map the future multi-year runoff mean values, and coefficients of variation and skewness. Then, the probability density function of multi-year runoff can be estimated using these values and the discharge with required probability of exceedance can be assessed. This method allows taking into account climate changes as well as the changes on the watershed physiography due to human activities [12].
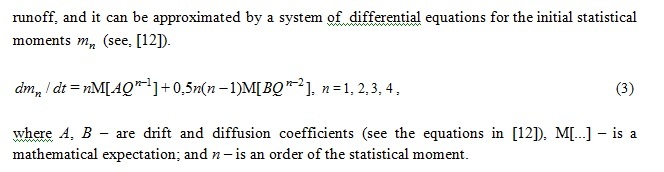
The system (3) allow to perform climate-based long-term forecast of multi-year runoff in term of probabilities, however the method based on the following assumption. The projections of future climate are usually presented as sequence of "evolutionary-stationary steps" of the meteorological variables for the time periods of 20–30 years and distributed as a set of statistical values (mean value and variation). Then, the projections of the hydrological variables are also stationary (i.e. in the equation (3)). This inevitable assumption raises the question about the features of the transition regime existing at the periods between two subsequent steps. The stochastic regime of such periods can shows both aperiodic and periodic oscillations with an abrupt ejections of the values over the limits of equilibrium states. However, this assumptions is not a shortcoming of the model itself in the true sense, but for the sake of simplicity, until now the system (3) was only applied for the sequence of “stationary steps”. This circumstance may leads to the incorrect assessment of the hydrological variables, but it provides the static overview of the possible changes in these hydrological characteristics, i.e what are they actually can be.
The study of the transition periods of the hydrological process is important since the climatological forcing cannot be presented as stationary. It is obviously, that the climate system possesses an interior and cannot change abruptly (“step-by-step”). Therefore, the hydrological and climate projections will be limiting as well; in other words if the statistical moments (or m1, Cv и Cs) demonstrate the ejections, and these values can be considered as upper boundaries. However, the core of the stochastic model (2) is a linear Eq. (1) and hence, the solutions of (2) are the probability distributions from the Pearson family. Thus, we can suppose that the stochastic hydrological transient process is usually can be performed as aperiodic, and this circumstance excludes the ejections of the hydrological variables over the limits obtained for the quasi-stationary climate [8].
Different aspects of the transitional hydrological regimes under the climate change are discussed in [8], where the Eq. (3) is presented as follow:
In the system (4), the low-order statistical moments are independent on the high-order moments, and it means that the high moments can be “lost”, and the system of the equation will stay closed. Thus, the system (4) can be simplified, viz. only first two equations are considered and the parameter can be neglected. This parameter performs the asymmetry of the simulated probability distribution, which was accounted in the present study via the fixed ratio of estimated for the past climate.
The study aims to perform the long-term forecast of the statistical characteristics of the spring flood for the territory of the Russian Arctic using climate projections. The objectives of the study are:
1. To prove hypothesis allowing to apply the system (4) to perform long-term forecast of the statistical characteristics multi-year river runoff formed under extreme climate conditions.
2. To examine the stability of the solutions for the system (4), i.e. are the simulated parameters of probability distributions pertain to the theoretical functions from the K. Pearson' family? In case of the unstable solutions of the system (4), the multi-dimensional probability distribution function (pdf) can be apply [12].
3. To outline the geographic location of alarm regions, where the projected hydrological statistical characteristics of the multi-year runoff are expected to change substantially compare with present and, hence the extreme flood could occur more frequently. RCP family climate scenarios are used to perform the hydrological response and flood frequency analysis for the coastal zone of the Russian Arctic.
4. To investigate the efficiency of the system (4) to perform the long-term forecast of parameters of the pdf under the expected climate change, and to proof the applicability of the multi-dimensional pdf under extremal warming.
III. Getting objectives: how to solve the problems
1. The linear filter (Eq. (1)) performs the core of the stochastic hydrological model (Eq. (2)), it assumes that the river runoff depends only on precipitation rate and runoff itself on the previous time step. Thus the general water balance equation describing behavior of hydrological chaotic system includes only two terms [12]. Thus, the effects of other variables (e.g. evaporation E and changes in the storage of soil moisture ±ΔU) could be accounted by the parameters of the model (Eq. (1)), and hence by the coefficients in the system (4), as well as completely avoided. This assumption allows to use one-dimensional pdf to perform the random runoff values, and hence only first four initial statistical moments are required to calculate parameters of pdf and to contrast the pdf using theoretical function from the Pearson' family. Such one-dimensional pdf is widely used in hydrological engineering applications to estimate the river runoff extremes with required probability of exceedance. The system (3) allows to model the statistical moments and pdf parameters of runoff. However, in the general water balance equation (), the weight of other terms (E and ±ΔU) are comparable with runoff value, and the evaporation can also exceeds the runoff. Therefore, only three-dimensional pdf provides the full-form statistical model to describe the chaotic behavior of the dynamic hydrological system performed by runoff series.
Problem of stability of the system (4) solutions is related to the hypothesis of applicability of one-dimensional pdf to represent random values of multi-year runoff, and “thick tails” and multi-modal distributions are widely obtained for observed runoff time series as result of this guess [7, 13]. To solve the problem of the system (4) solutions stability, the method to modify the core model (1) was suggested by Kovalenko [7]. The method is based on the hypothesis, that stability of the solutions (4) can be reached through increasing of number of the general water balance terms. Then, the system (4) can be solved for runoff, evaporation and soil water contents, and the behavior of hydrological chaotic system can be perform with multi-dimensional pdf in this case.
To assess the dimension of pdf (and the number of terms of the general water balance) required to perform runoff process the methods of chaotic analysis were apply. The correlation dimension were estimated, the number of embedding dimensions were assessed using observed multi-year annual runoff time series [7]. The method applied by Kovalenko [7] based on the Takens theorem [22], which allows to estimate the correlation (fractal) dimension and minimum number of dimension in the state-space need to perform behavior of chaotic system adequately. Then, the dimension of pdf used to perform multi-year runoff time series equals to the nearest integer number exceeding the correlation dimension [6]. Fig. 1 shows the relationship between the runoff fractal dimension ( ) and air temperature. This relationship is obtained based on the analysis of the historical time series of annual river runoff for 756 rivers located in the North and South hemispheres [10].
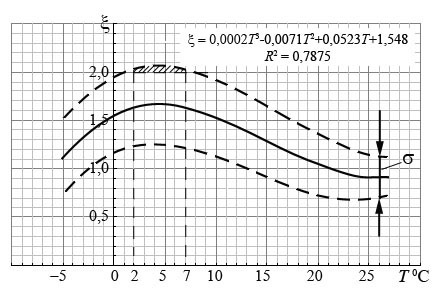
Fig. 1. Relationship between fractal dimension of annual runoff time series and climatological mean values air temperature (adopted from [10]).
The embedding dimensions of phase-space required to perform the dynamics chaotic hydrological system is greater than two only for the narrow range of the air temperatures located between 2–7 °C for the values of ED within the standard deviation (σ) presented the probability of occurrence 33 %. This temperature range is twice more if the zone expands to 2σ, however, the probability of occurrence is twice less in this case. In this temperature range, the hypothesis that only one-dimensional projection of pdf (p(Q)) to represent multi-dimensional pdf (p(Q, E, ΔU)) and to perform the behavior of chaotic hydrological system does not proved [10].
For the northern territories and for the coastal zones of the Russian Arctic in particular, the climatological mean air temperatures are lower than 2 °C and thus, the hydrological system can be represented by only one-dimensional pdf to perform random multi-year runoff time series. Moreover, the situation is similar in the regions with warm climate, where the mean values of air temperature greater than 7 °C (Fig. 1). For the Polar and Equatorial Regions the hydrological processes are more simple and only one-dimensional distribution p(Q) is necessary to perform the chaotic system dynamic [8]. Thus, this circumstance allows to apply the core hydrological model in form of one-dimensional linear filter model with stochastic components to perform multi-year runoff on the territory of the Russian Arctic, and further simplification of (1) described in details in [12].
2.
Eq. (6) is the solution of the FPK equation, which is usually apply to evaluate the parameters of the autocorrelation functions of Markov chain random process. The type of random model is widely used to perform the multi-year runoff process [14]. Thus, the time shift ∆t = 1 in this case, and the Eq. (6) can be modified in form of Eq. (5).
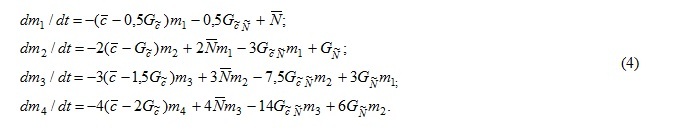
The stability criterion β was estimated using the multi-year time series of annual runoff of the rivers with watershed of medium size situated within water resourse boundaries of the Russian Arctic outlined as suggested by Ivanov and Yankina [5]. Also, the values of the stability criterion were calculated for the multi-year time-series of the spring flood runoff allowing to assess the peak flow (or maximum runoff and extremes) for the rivers located on the northern territories, and in the Russian Arctic in particular (Fig. 2). The Fig. 2 shows that for most part the Russian Arctic except the catchments located on the east of European Arctic and upstream of Lena River the system (4) has stable solutions allowing to provide the long-term predictions of statistical characteristic of the maximum runoff based on the climate projections [2] distributed by IPCC.
3. The system (4) was used to perform the regional-scale forecast of the mean values and coefficient of variation of the spring flood multi-year runoff based on the climate projections for the territory of the Russian Arctic. The alarm regions, where the projected values of the mean values and coefficient of variation of the spring flood multi-year runoff will change substantially compare with present state, and these changes should be accounted to perform the risk assessment for present and future hydraulic structures located on the Russian Arctic. The regional-oriented parametrization of the model (4) allows to consider the changes on the numerical values for the model  parameters coefficient depending on the projected climatology (
 and ). The regional scale forecasts of the mean values and coefficient of variation of the spring flood multi-year runoff were obtained for several scenarios from the Fourth and Fifth Assessment Report of IPCC (Tables 1 and 2). The outputs from the global general circulation models MPIM:ECHAM5, CGCM2, GFDL:CM2 and UKMO:HADCM3 (Fourth Report, see Table 1), INM-CM4, HadGEM2, CanEMS2, MPI-ESM (Fifth Report, see Table 2) were used.
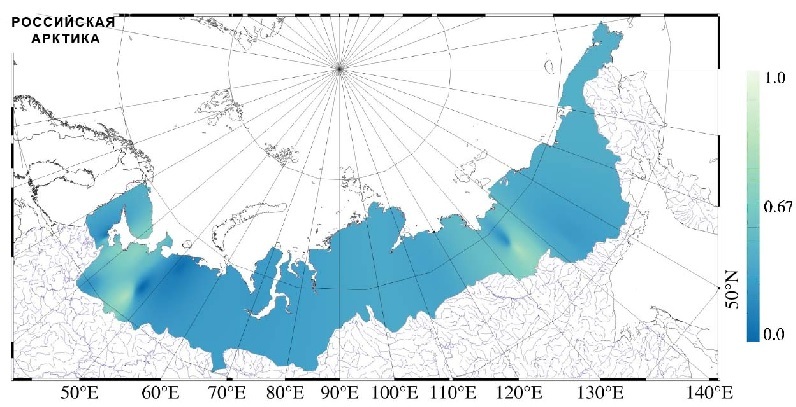
Fig. 2. Spatial distribution of the stability criterion numerical values for the maximum runoff formed on the territory of the Russian Arctic within the boundaries according to Ivanov and Yankina [5].
Table 1. Mean values of annual precipitation amount ([mm]) and air temperature ( [ºC]): observations and projection by the Coupled Atmosphere-Ocean General Circulation Models (CAOGCM) for the period 2010–2039
|
Region |
1936–80 |
COMMIT |
SRES:A1B |
SRES:A2 |
SRES:B1 |
|||||
|
|
|
|
|
|
|
|
|
|
|
|
|
Arctic region as a whole |
378 |
–10,3 |
418 |
–10,2 |
433 |
–9,9 |
435 |
–9,2 |
437 |
–9,4 |
|
Karelia and the Kola Peninsula |
506 |
–0,6 |
580 |
–2,0 |
589 |
–1,6 |
596 |
–1,2 |
598 |
–1,3 |
|
East European part |
528 |
–2,1 |
583 |
–3,7 |
603 |
–3,5 |
602 |
–2,7 |
608 |
–3,0 |
|
Ob-Yenisei Region |
438 |
–7,1 |
404 |
–11,1 |
506 |
–7,8 |
429 |
–9,9 |
426 |
–10,3 |
|
Eastern Siberia |
296 |
–14,5 |
350 |
–12,8 |
379 |
–12,2 |
359 |
–11,8 |
364 |
–12,1 |


The increase of the mean values of the spring flood multi-year runoff (maximal) and the decrease of the coefficients of variation were predicted in the Arctic region as a whole according to most considering climate scenarios. These trends of the basic statistics are expected also for particular regions as well, the well pronounced increase of the mean values of the spring flood runoff is expected within the East European territory of the Russian Arctic (of over 47 % in average) and for the East Siberian (of over 37 %) region except the Chukchi Peninsula. However, the values of the coefficients of variation were obtained to decrease of over 22–23 % in these regions. The reverse trends were predicted for the territories of the Kola Peninsula and Karelia, were the significant decrease of the mean values of spring flood multi-year runoff (of over 27 %) and the increase of the coefficients of variation of over 14 % were predicted.
Within whole territory of the Russian Arctic for the period 2010-2039, the decrease of the coefficients of variation of the spring flood multi-year runoff of over 12 % is expected according to all considerate scenarios and CAOGCM from both reports of the IPCC. The minor changes of the coefficients of variation (of over 3 %) were predicted based on the output from the HADCM3 CAOGCM, and greatest changes up to 24 % in the coefficients of variation were obtained according to output of the ECHAM5/MPI under the SRES:A1B scenario. In general, the scenarios of the Fifth Report show less uncertainty in the estimates performed the changes of the coefficients of variation of the spring flood multi-year runoff comparing with the scenarios of the Fourth Report of the IPCC.
Table 2. Mean values and the coefficients of variation (Cv) of the spring flood milti-year runoff (m1 [mm]): the observations and estimates based on the output from the CAOGCM for the period 2010–2039
|
Region |
1936–80 |
COMMIT |
SRES:A1B |
SRES:A2 |
SRES:B1 |
|||||
|
m1 |
Cv |
m1 |
Cv |
m1 |
Cv |
m1 |
Cv |
m1 |
Cv |
|
|
Arctic regions as a whole |
162 |
0,30 |
191 |
0,27 |
200 |
0,26 |
205 |
0,25 |
203 |
0,25 |
|
Karelia and the Kola Peninsula |
179 |
0,32 |
129 |
0,38 |
129 |
0,36 |
135 |
0,36 |
129 |
0,36 |
|
East European part |
203 |
0,29 |
303 |
0,23 |
303 |
0,22 |
293 |
0,22 |
295 |
0,22 |
|
Ob-Yenisei Region |
204 |
0,23 |
209 |
0,23 |
222 |
0,22 |
222 |
0,22 |
220 |
0,22 |
|
Eastern Siberia |
108 |
0,38 |
129 |
0,36 |
150 |
0,28 |
159 |
0,28 |
155 |
0,27 |
For the Russian Arctic, the tendencies to increase of the mean values and to decrease of the coefficients of variation of the multi-year maximum runoff (formed during the spring flood) were predicted to be stable until 2100. Further substantial changes of the mean and variability of maximal runoff of over 25–40 % were expected for the whole territory of Siberia and the European part of Arctic. The alarm regions, where the projected changes of the statistical characteristics of the maximum runoff are expected to be more than the calculation errors (see [12]) were outlined (see example in Fig. 3).
These maps are useful as broad scale regional estimates for the long-term planning of development of socio-economic infrastructure within the Russian Arctic, and to develop practical recommendations to account the expected climate changes in engineering calculations of the maximum runoff with requires probability of exceedance required to design of hydraulic construction projects and to estimated the risks during their operation. Also, the estimates of changes in break-up, start and maximum of the spring flood for selected gauges located in the big estuaries of the rivers of the Kara Sea basin (for details, see [16, 17]) were obtained.
4. The results presented above were obtained based on the assumption the hydrological time series until 1980s remains acceptable and, hence it allows to perform the model (4) regional-oriented parameterization, despite the fact that the warming is continuously detected on the observed time series. However, this assumption is also can be questioned and the understanding of this issue can be refers to the Fig. 1, which shows the relationship between the fractal dimension of the annual runoff multi-year time series and mean values of annual air temperature. What kind of physical and geographical factors can explain such decrease of the fractal dimension at the both ranges of high and low temperatures?
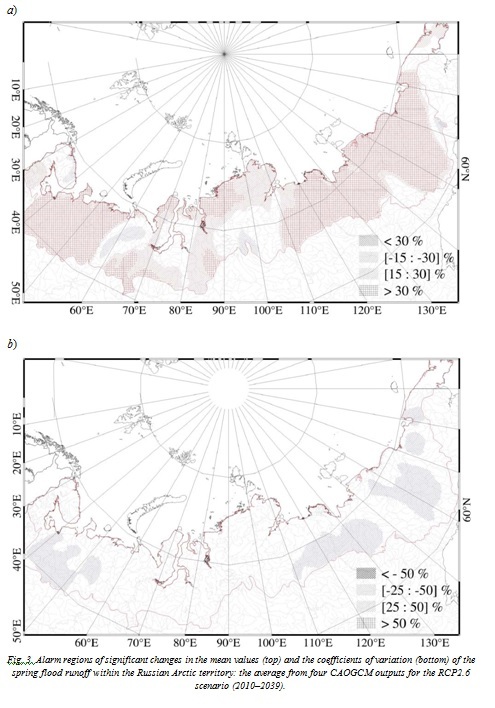
Fig. 3. Alarm regions of significant changes in the mean values (top) and the coefficients of variation (bottom) of the spring flood runoff within the Russian Arctic territory: the average from four CAOGCM outputs for the RCP2.6 scenario (2010–2039).
Besides runoff, the evaporation and soil moisture content (mainly within active layer) are involved to general water balance equation performing the long-term hydrological processes on the river basins. However, the thickness of the active layer within the Arctic regions is usually low and, this values is minor due to existing of permafrost? Also, the role of evaporation is much smaller compared with the regions located south within mid-latitude climate zones. Thus, the relationship curve on Fig. 1 falls below the value of 2 in the part related to the range of low temperatures. Also, there is no paradox if the regions located within the high temperature are considered since the ground waters underlie deep underground and the active layer play the role of dryer to exclude the soil moisture content from the general water balance, where the soil moisture and evaporation consider as losses. However, the evaporations losses are usually represented with more general term of moisture deficit, as suggested in formula by Tyrk [15].
The relationship shown in the Fig. 1 can be transformed under the new climate. In the Polar Regions, where the air temperature is expected to increase drastically compare with other regions, the permafrost would begin to melt and the thickness of active layer started to provide the substantial values of soil water content. Also, the evaporation rate also will be increase and would takes significant amount in the general water balance of the river basins. Thus, these terms of water balance would start playing an active role in the long-term water exchange. This circumstance may shift the mean values of air temperature within the Russian Arctic into direction of higher temperatures and fractal dimensions (see Fig. 1), and the multi-dimensional pdf (p(Q, E, ΔU)) would require to perform the climate-based forecast of the statistics of the multi-year runoff in Arctic, and on the coastal zone of Russia in particular as suggested by Kovalenko et al. [12].
To summarize the results presented in this paper we can conclude:
1. The methods of the fractal analysis and linear stability theory prove the applicability of the model of linear filter (1) as dynamic core of the stochastic model and its further simplification to evaluate the long-term estimates of the hydrological response to the expected climate change for the Russian Arctic.
2. The projected mean values and coefficient of variation of the multi-year spring flood runoff were assessed based on the climate scenarios of the Fourth and Fifth reports of the IPCC. The alarm regions with substantial changes in the statistical characteristics of the spring flood peak multi-year runoff were outlined. For these regions the adaptation strategies allowing to reduce possible risk for the coastal systems due to the expected climate change could be developed.
3. The genesis of the possible impasses connected with development of the predictive model adapted to the regional application is shown. This adapted model allows to perform broad scale assessment of hydrological response over the Russian Arctic and its coastal zones in particular. The global warming amplified drastically in the Polar regions results the increase of the number for the space embedding dimension and require the substantial improvement of the model (4) due to strengthening of the role of evaporation and increase of the active layer of soil due to permafrost thawing.
The study was partially funded by Ministry of Education and Science of the Russian Federation within the project "Adaptation of mathematical models of runoff formation to perform the long-term probabilistic climate based forecast of multi-year river runoff for different the physical and geographical conditions of Russia for the purposes connecting to ensure the sustainability of their solutions in modelling and forecasting» (No. 1413, No. of the State registration 01 2014 58678).
1. Bulletin 17-B: Guideline for determining flood flow frequency, U.S. Geological Survey, Virginia, 1982.
2. Dankers, R. and Feyen, L.: Climate change impact on food hazard in Europe: an assessment based on high-resolution climate simulations, Journal of Geophysical Research: Atmospheres, 113, D19105, doihttps://doi.org/10.1029/2007JD009719, 2008.
3. Gel'fan A. N. Dinamiko-stokhasticheskoye modelirovaniye formirovaniya talogo stoka. - M.: Nauka, 2007. - 279 s., (in Russian).
4. Groysman P. YA. Empiricheskiye otsenki svyazi protsessov potepleniya i pokholodaniya s rezhimom uvlazhneniya territorii SSSR. // Izv. AN SSSR, seriya geogr., 1981, № 5, s. 86 - 95, (in Russian).
5. Ivanov, V. and Yankina, V.: Water resources of Arctic: past and future aims of research, Problem of Arctic and Antarctic, 66, 118-128, 1991, (in Russian).
6. Jayawardena A.W. and Gurung A.B., 2000. Noise reduction and prediction of hydro meteorological time series: dynamical system approach vs stochastic approach. Journal of Hydrology. 228. 242-264.
7. Kovalenko V. V. Obespecheniye ustoychivosti modelirovaniya i prognozirovaniya rechnogo stoka metodami chastichno infinitnoy gidrologii. - SPb., izd. RGGMU, 2011. - 107 s., (in Russian).
8. Kovalenko V. V. Perekhodnyye protsessy pri otsenivanii dolgosrochnykh gidrologicheskikh posledstviy izmeneniya klimata // Uchenyye zapiski RGGMU, № 41, 2015. - S. 48-54, (in Russian).
9. Kovalenko V. V. Primeneniye veroyatnostnoy modeli dlya ustoychivykh dolgosrochnykh otsenok modal'nykh znacheniy kharakteristik mnogoletnego rechnogo stoka // Meteorologiya i gidrologiya, 2014, № 1, s. 85 - 91, (in Russian).
10. Kovalenko V. V., Gaidukova E. V. Influence of climatological norms of the surface air temperature on the fractal dimensionality of the series of long-term river discharge // Doklady Earth Sciences. T. 439, № 2, 2011. - P. 1183-1185.
11. Kovalenko V. V., Gaidukova Ye. V., Viktorova N. V. Praktikum po distsipline «Modelirovaniye gidrologicheskikh protsessov. Chast' II. Stokhasticheskiye modeli» (na baze yazyka S++). Uchebnoye posobiye. - SPb.: izd. RGGMU, 2012. - 248 s., (in Russian).
12. Kovalenko V. V., Viktorova N. V., Gaidukova Ye. V. Modelirovaniye gidrologicheskikh protsessov. Uchebnik. Izd-ye 2-ye isprav. i dop. - SPb., izd. RGGMU, 2006. - 559 s., (in Russian).
13. Naydenov V. I. Nelineynaya dinamika poverkhnostnykh vod sushi. - M.: Nauka, 2004. - 318 s.
14. Rogdestvenskiy A. V. (Edt.) Spatial and temporal variations of river flow in USSR, Gidrometeizdat, Leningrad, 1988. (in Russian).
15. Roger Lambert. Geographie du cycle de l’eau. - Presses Universitaires du Mirail, 1996.- 439 p.
16. Shevnina Ye. V. Metody dolgosrochnogo prognozirovaniya srokov nachala i dostizheniya maksimuma vesennego polovod'ya na ust'yevykh uchastkakh Obi I Yeniseya // Meteorologiya i gidrologiya, № 1, 2009. - S. 75-84, (in Russian).
17. Shevnina Ye. V., Solov'yeva Z. S. Mnogoletnyaya izmenchivost' i metody prognozirovaniya srokov vskrytiya v ust'yevykh oblastyakh Obi i Yeniseya // Meteorologiya i gidrologiya, № 7, 2008. - S. 73-84, (in Russian).
18. Shiklomanov I. A. Issledovaniye vodnykh resursov sushi: itogi, problemy, perspektivy. - L.: Gidrometeoizdat, 1988. - 153 s, (in Russian).
19. Shiklomanov I. A. Vliyaniye khozyaystvennoy deyatel'nosti na rechnoy stok. - L.: Gidrometeoizdat, 1989. - 336 s., (in Russian).
20. SNIP 2.01.14-83. Opredeleniye raschetnykh gidrologicheskikh kharakteristik / Gosstroy SSSR. - M.: Stroyizdat, 1985. - 36 s., (in Russian).
21. SP 33-101-2003. Opredeleniye osnovnykh raschetnykh gidrologicheskikh kharakteristik. - M.: FGUP TSPP Gosstroy Rossii, 2004. - 73 s., (in Russian).
22. Takens F., 1981. Detecting strange attractors in the turbulence. In: Rand, D.A. and Young L.S. Eds. Lectures Notes in Mathematics. Vol. 898. Springter-Verlag, New York, 366-381.
23. Vinnikov K. YA. Chuvstvitel'nost' klimata. - L.: Gidrometeoizdat, 1988. - 224 s., (in Russian).