


BISAC NAT010000 Ecology
BISAC NAT045050 Ecosystems & Habitats / Coastal Regions & Shorelines
BISAC NAT025000 Ecosystems & Habitats / Oceans & Seas
BISAC NAT045030 Ecosystems & Habitats / Polar Regions
BISAC SCI081000 Earth Sciences / Hydrology
BISAC SCI092000 Global Warming & Climate Change
BISAC SCI020000 Life Sciences / Ecology
BISAC SCI039000 Life Sciences / Marine Biology
BISAC SOC053000 Regional Studies
BISAC TEC060000 Marine & Naval
Baltic Sea hydrology is quite well explored. Nevertheless, the majority of classical and recent colligative research of Baltic Sea was focused on its off-lying part, shaping several regional databases – HELCOM, ICES. Thus data for 12-mile near shore zone in the Russian part of South-Eastern Baltic is nearly not represented. IKBFU and ABIORAS employees have gathered an array of measurements, made by CTD probes in Kaliningrad region coastal area during the last 15 years. It was this fact, which make possible to examine a seasonal variability of thermal and halinic structure of shallow marine areas. The pre-analysis revealed that there is only slight variability in salinity (at about 0.5 psu) in the region of interest. Therefore, the main aim of following work is to analyze a different-scale variability of the vertical thermal structure of Kaliningrad region’s marine coastal areas. This analysis showed two types of the variability – long-term and short-term. The long-term one is represented by seasonal cycle of meteorological features, affecting in a strong way on the hydrological behavior of Baltic sea. The short-term one are regarded as brief, but violent perturbations – storms. While carrying out this research, the quantitative estimates of thermal structure alteration time were made along with features of thermal structure variability for marine coastal areas.
different-scale variability, stratification, thermohaline structure, Baltic sea.
I. Introduction
It is well known that hydrological conditions are the most important abiotic parameters of marine ecosystems functioning. On the one hand, the water area of the Baltic Sea has been well explored. On the another hand, attention of summarizing works on the Baltic Sea [2], [3], [5] are focused on its open part. Arrays of CTD-measurements in the Russian territorial waters of south-eastern Baltic are practically not represented in the global marine databases – for instance, HELCOM, ICES. The purpose of this paper is to describe the annual variability of thermal and salinity structure in shallow sea areas of the Baltic Sea alongshore the Kaliningrad region on the basis of the array of collected during 12 years CTD-measurements.
II. Data and methodology
The outer limit of the Kaliningrad region coastal zone is signed along the 30 m isobath [7], [1]. There were carried out both single hydrological surveys and systematic long-term observations (Figure 1) in the area of interest from year 2003 to 2015. The measurements were made with a use of modern CTD-probes: CTD90M, Idronaut 316, STD-2a and YSI 600XLM. Data from 1278 hydrological stations was received and processed in total. Small vessels usage allowed conducting measurements from a depth of 3 m. In the area of oil platform D-6 (in Figure 1, it marked with the symbol ▲) measurements were made monthly since 2011.
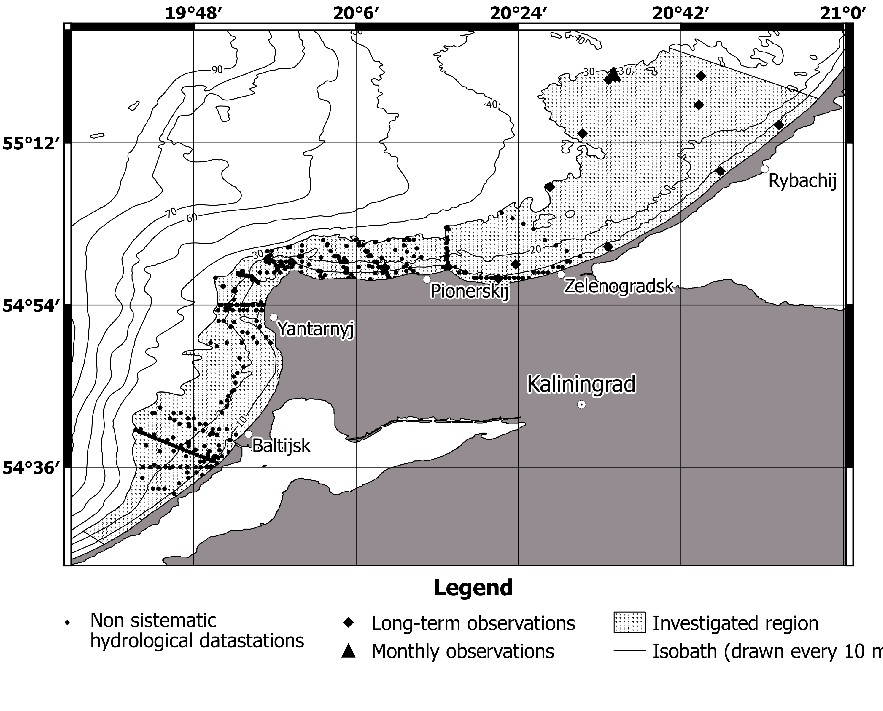
Fig. 1. The map of datastation distribution.
It should be noticed, that in the Gdansk basin seasons don’t correspond with classical seasons due to regional climatic features, so by the period from January to March is meant winter, April-June – the spring, July to September – the summer, October-December – autumn [11].
Analysis of the variability of water structure of the area of interest was carried out on the basis of the averaged profiles of basic hydrological parameters vertical distributions. The transition from seasonal sampling series of the field data to the averaged seasonal profiles was performed by the method of layer-by-layer median filtering [6]. The key point of the approach is to calculate the median value for a layer with arbitrary thickness (in this study this parameter was taken as 1 m).
III. Results
Features of the thermohaline structure of open part waters of the south-eastern Baltic are known [4]. The main factors here are the general atmospheric circulation, continental runoff, and water exchange with the North Sea. In the coastal zone of the sea an importance of the coastline exposure, the prevailing winds and the relief of the underwater coastal slope increases, while the effect of water exchange with the North Sea is weakening [8]. Such change in structure-forming conditions, as well as a decrease in the volume and heat storage in coastal waters leads to occurrence of specific features in the thermal and salinity structure and characteristics of its variability.
For example, in the coastal zone in winter can be seen an inverse thermal stratification. Water temperature slightly increases with depth, reaching a maximum value (3 °C) at the bottom. There is a rising of the sea surface temperature in spring which is caused with the beginning of spring warming. The maximum values of surface temperature are observed in summer (up to 20-22 °C at the end of July-mid August). Autumn cooling of the surface activates the processes of the autumn-winter convection, gradually forming a mixed layer to a 30 m depth. Halocline lies at depths of wind mixing (5-15 m), regardless of the season. The maximum values of salinity are observed at the bottom, the minimum – at the surface.
Therefore, the most interesting periods (being interested in seasonal variability of the thermohaline structure of coastal waters) are spring and autumn, when there is an active restructuring of the water column of the area of interest.
In particular (Figure 2 a), the change in the spring vertical thermal and salinity structure is characterized by the following features: from April to June appears an increase in temperature throughout the entire water column – from 6.5 (in April) to 15 °C (June) on the surface and 2.5 (in April) to 7.5 °C (June) in the bottom layer. In April, the thermocline is at a depth of about 2 meters. It deepens to 15 m in June. Salinity demonstrates the general increase with depth, salinity values in the surface of the following: 6.25 psu – in April, 6.8 psu – in May, 6.55 psu – in June. The changes of salinity in the bottom layer: 7.15 psu – in April, 7.3 psu – in May, 7.6 psu – in June. Decrease in salinity of the surface layer in June is connected with an increase in precipitation.
In October the water temperature for the entire water column changes slightly: at a depth of about 2 m a thermocline is formed due to diurnal warming – a gradient is 0.1 °C/m. In November water of surface layer reaches a temperature about 9 °C, at a depth of about 5 meters and 12 are located temperature surges with range 0.25 °C. The mixed layer with the temperature about 10 degrees is located from 12 meters depth to the bottom (Figure 2 b).
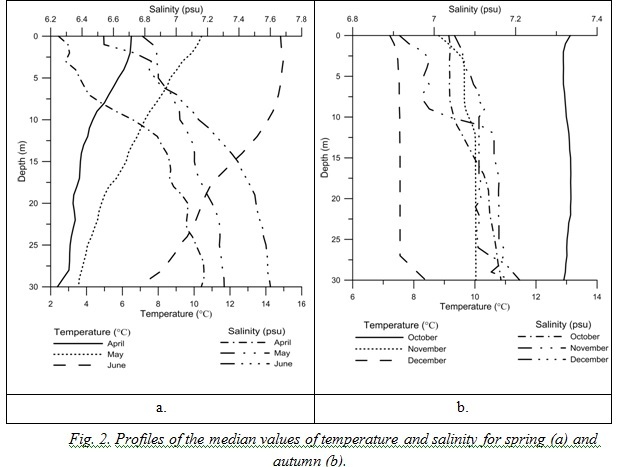
The temperature of the surface layer in December is within 7-7.5 °C, at a depth of about 27 meters thermocline is distinguishable, in the bottom layer temperature reaches 8.2 °C. In October, the salinity increases from 7.03 psu in the surface layer up to 7.1 psu – in the bottom, in November – from 6.9 to 7.18 psu, in December salinity varies with depth in the range 7.05-7.2 psu. In the autumn-winter season, the salinity of the surface layer increases slightly due to reduced river inflow. Low salinity value in November associated with an increase in rainfall.
The thermal structure variability of coastal waters not only follows slow within-year alteration, but also time to time experiences short-term (2-3 days) storm impacts. An example of such event was the 10-hours storm that was recorded on July 19, 2012 near the town of Pionerskij. Hydrological structure and weather conditions before the storm are shown in Figures 3a and 3b, after the storm – in Figure 4a and 4b.
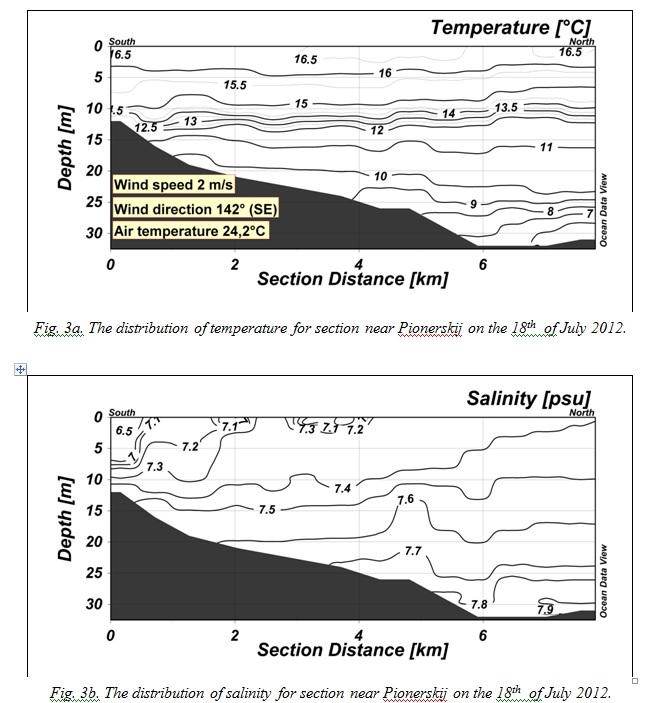
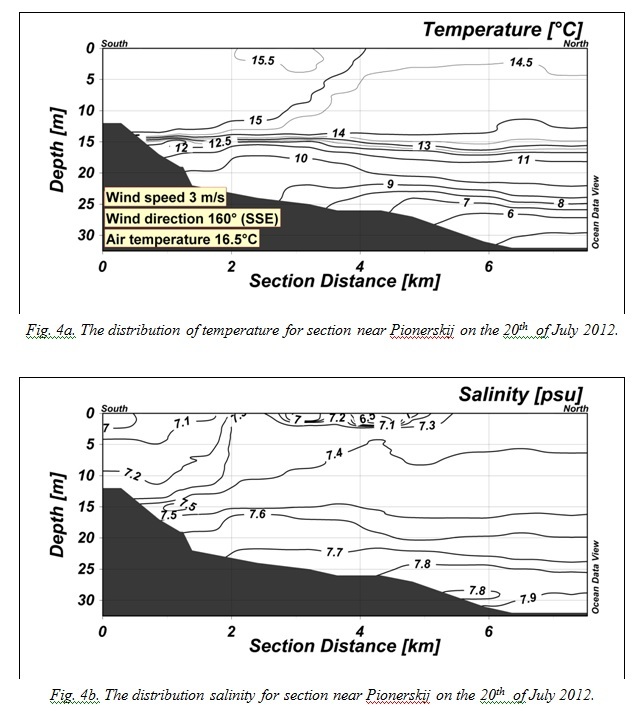
On July 19, 2012 in the study area were observed passing thunderstorm, which was accompanied by the wind direction change to north-west (310 °) and increase of its average speed to 8-9 m/s and gusts up to 12-14 m/s. Such wind disturbance lasted for 6 hours. The total duration of the storm was about 10 hours. The average air temperature during this period dropped to a value of 15.4 °C. The thermohaline structure in the area was rebuilt during the storm. Specifically, the heated upper surface layer (3-5 m thick) with 16-16.5 °C temperature disappeared. On 20 July there was a well-mixed layer of water with a 14.5-15 °C temperature and a 12-13 m thick in this place. The thickness of the thermocline has decreased from 5-6 m to 2-3 m. The bottom layer at a depth of 30 m has +5 °C temperature, which was 1 °C lower than before the storm. In the salinity distribution significant changes weren’t noticed.
IV. Conclusions
Analysis of experimental data sets showed that seasonal variability of coastal waters, in general, corresponds to known climatic descriptions [9], [12]. However, distributions of the main hydrological characteristics in the profiles showed lower (by 1-3 °C) temperatures and higher salinity in the upper part (up to 15 m) in spring. Described in the atlas decrease in salinity values in autumn at 0.4-0.5 psu from the surface to depths of 20-25 m has not been confirmed by field observations.
This research has shown that the vertical thermal structure of the Baltic shallow waters alongshore the Kaliningrad region has two main time scale variabilities: slow seasonal variations and short-term (2-3 days) episodic changes, connected with storms passages, showing intensity and number increasing in recent years [11].
V. Acknowledgments
This study was financed by the Russian Scientific Fund (grant 14-37-00047).
1. A. N. Babakov, “Dynamics of Sedimentary Substances in the Coastal Zone of the Sea”, in Neft' i okruzhayushchaya sreda Kaliningradskoj oblasti. Tom II: More (Oil and the Environment of the Kaliningrad Region. Volume II: Sea), Kaliningrad: Terra Baltica, 2012, pp. 37-59.
2. A. Omstedt, J. Elken, A. Lehmann, M. Leppäranta, H.E.M. Meier, K. Myrberg, A. Rutgersson, “Progress in Physical Oceanography of the Baltic Sea during the 2003-2014 Period,” Progress in Oceanography , no. 128, 2014, pp.139-171.
3. Atlas of the Baltic Sea, ed. by A. Majewska and Z. Lauer. Warsaw: Institute of Meteorology and Water Management, 1994, 214 p.
4. D. Rak, P. Wieczorek, “Variability of temperature and salinity over the last decade in selected regions of the southern Baltic Sea,” Oceanologia, no. 54(3), 2012, pp. 339-354.
5. Hydrometeorology and Hydrochemistry of the USSR Seas. Volume III. The Baltic Sea. Issue I. Hydrometeorological Conditions, ed. by F. S Terziev, V. A. Rozhkov, A. I. Smirnova, St. Petersburg: Gidrometeoizdat, 1992, 449 p.
6. I. M. Belkin, Morphological and Statistical Analysis of the Ocean Stratification, Leningrad: Gidrometeoizdat, 1991, 130 p.
7. I. O. Leontiev, Coastal Dynamics: Waves, Currents, Sediment Flows, Moscow: GEOS, 2001, 272 p.
8. K. Bowden, Physical oceanography of coastal waters, Chichester: Ellis Horwood Ltd., 1983, 302 p.
9. State and Evolution of the Baltic Sea, 1952 - 2005. A Detailed 50-Year Survey of Meteorology and Climate, Chemistry, Biology, and Marine Enviroment, ed. by R. Feistel, G. Nausch, N. Wasmund, 2008, [Electronic resource] Leibniz Institute for Baltic Sea Research Warnemünde [Official website]. URL: http://www.io-warnemuende.de/baltic2008/index.html (accessed: 25.02.2016).
10. V. F Dubravin, Zh. I. Stont, “Hydrometeorological Mode, Water Structure and Circulation,” in Neft' i okruzhayushchaya sreda Kaliningradskoj oblasti. Tom II: More (Oil and the Environment of the Kaliningrad Region. Volume II: Sea), Kaliningrad: Terra Baltica, 2012, pp. 69-105.
11. V. P. Bobykina, Zh. I. Stont, “Winter storm activity in 2011-2012 and its consequences for the south-eastern Baltic coast”, Water Resources. vol. 42, no 3, 2015, pp. 371-377.
12. World Ocean Atlas 2014 Product Documentation, [Electronic resource], National oceanographic data center of National Oceanic and Atmospheric Administration. [Official website], URL: http://www.nodc.noaa.gov/OC5/indprod.html. (accessed: 27.03.2016).