BISAC NAT010000 Ecology
BISAC NAT045050 Ecosystems & Habitats / Coastal Regions & Shorelines
BISAC NAT025000 Ecosystems & Habitats / Oceans & Seas
BISAC NAT045030 Ecosystems & Habitats / Polar Regions
BISAC SCI081000 Earth Sciences / Hydrology
BISAC SCI092000 Global Warming & Climate Change
BISAC SCI020000 Life Sciences / Ecology
BISAC SCI039000 Life Sciences / Marine Biology
BISAC SOC053000 Regional Studies
BISAC TEC060000 Marine & Naval
Sea Surface Temperature Anomalies (SSTA), in four coastal hydrographic stations of Colombian Pacific Ocean, were analyzed. The selected hydrographic stations were: Tumaco (1°48'N-78°45'W), Gorgona island (2°58'N-78°11'W), Solano Bay (6°13'N-77°24'W) and Malpelo island (4°0'N-81°36'W). SSTA time series for 1960-2015 were calculated from monthly Sea Surface Temperature obtained from International Comprehensive Ocean Atmosphere Data Set (ICOADS). SSTA time series, Oceanic Nino Index (ONI), Pacific Decadal Oscillation index (PDO), Arctic Oscillation index (AO) and sunspots number (associated to solar activity), were compared. It was found that the SSTA absolute minimum has occurred in Tumaco (-3.93°C) in March 2009, in Gorgona (-3.71°C) in October 2007, in Solano Bay (-4.23°C) in April 2014 and Malpelo (-4.21°C) in December 2005. The SSTA absolute maximum was observed in Tumaco (3.45°C) in January 2002, in Gorgona (5.01°C) in July 1978, in Solano Bay (5.27°C) in March 1998 and Malpelo (3.64°C) in July 2015. A high correlation between SST and ONI in large part of study period, followed by a good correlation with PDO, was identified. The AO and SSTA have showed an inverse relationship in some periods. Solar Cycle has showed to be a modulator of behavior of SSTA in the selected stations. It was determined that extreme values of SST are related to the analyzed large scale oscillations.
Sea Surface Temperature, Colombian Pacific Ocean, ENSO, PDO, Solar Cycle.
I. Introduction
In a context of global warming in recent times it has become important the study of atmospheric and oceanic processes that influence or are precursors of extreme events that may affect the quality of life in coastal areas. According to the Intergovernmental Panel on Climate Change [1]., an extreme event is defined as the occurrence of a weather or climate value that has exceeded its upper or lower threshold within the range of the observations of the variable. In the world there are many studies about finding a relationship between the occurrence of extreme events and long period phenomena, for example in [2]. with modeled data, a great association has been shown between El Niño southern Oscillation (ENSO) with the Pacific Decadal Oscillation (PDO) phenomena and extremes of temperature and precipitation on the west of the US. Particularly for extreme values identified in the Sea Surface Temperature (SST), there are research associated with events of coral bleaching, such as in [3]. where the effect of the positive phase of ENSO on events of coral beaching has been analyzed for the Gulf of Panama and the Galapagos Islands. In the Colombian seas, there is information about the occurrence of extreme weather phenomena; as an example there are the data with number of extreme events given by the Colombian Oceanographic and Hydrographic Research Center in [4]. Which show an increase in number and frequency of these events in the Colombian Caribbean Sea (CCS) and the Colombian Pacific Ocean (CPO). For CCS in [5]. have been analyzed extreme events for the Caribbean basin related to the height of waves, taking into account their occurrence during short period phenomena such as the transit of cold fronts or hurricanes, which can generate flooding or damage to structures. In the CPO there are studies focused on finding relationships between Sea Surface Temperature SST and SSTA with long period phenomena as [6]. where was shown a high association between SSTA and ENSO, but without referring to extreme values. Thus, this paper aims to identify the extreme values of Sea Surface Temperature (SST) associated with long period phenomena for coastal hydrographic stations in the CPO. The behavior of the SSTA is analyzed to identifying their extreme values; also the behavior of indicators of long-period phenomena such as Oceanic Niño Index (ONI), the Pacific Decadal Oscillation (PDO) index, the sunspots number, and the Arctic Oscillation (AO) Index have been analyzed. Finally the relationship of long period phenomena with found SST’s extreme values is determined.
II. Methodology
The study area was the CPO, located between 77°45'W and 84°00'W of longitude and between 1°30'N and 6°30'N of latitude (Fig. 1), in this area, four coastal hydrographic stations were chosen: Two of continental coastal type; Solano Bay, located in 6°13'N-77°24'W and Tumaco, located at 1°48'N-78°45'W. Two of insular coastal type; Gorgona island, located in 2° 58'N-78°11'W and Malpelo Island, located at coordinates 4°0'N-81°36'W.
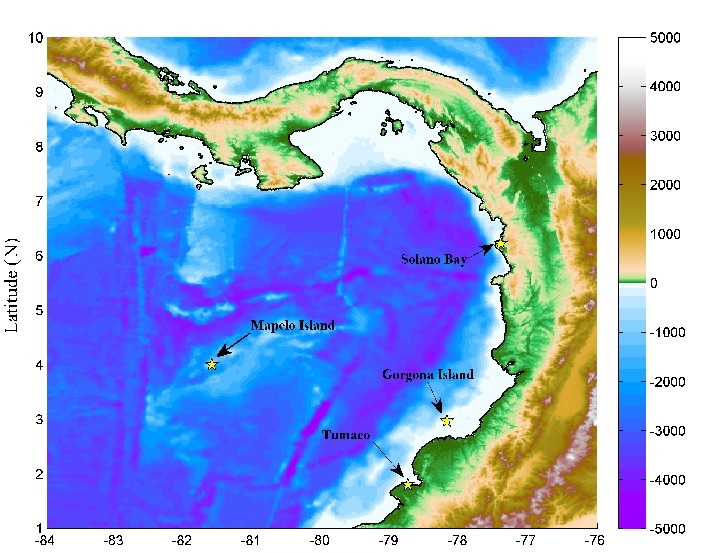
Fig. 1. Bathymetric and topographic map of Colombian Pacific Ocean, with locations of coastal hydrographic stations. Source: Plotted from ETOPO1 data.[7]
Monthly SST data were obtained for period between 1960 and 2015 from the database Comprehensive Ocean Atmosphere Data Set (ICOADS) [8]. were used. Monthly values of ONI were obtained from database of the Climate Prediction Center [9]. Monthly data of PDO and AO indexes from the Joint Institute for the Study of the Ocean and Atmosphere [10]. And sunspots number data from Marshall Space Center NASA [11]. The SST climatology in each station were calculated taking into account the base periods 1981-2010 and 1961-1990 following the procedure given in [12]. Missing data of SST were replaced with their corresponding climatological values considering their respective values in the base period. SSTA ASST(t) (°C) for all month t were calculated as follows:

In each season S = 1-3 (January-March), 4-6 (April-June) 7-9 (July- September): 10-12 (October-December). The occurrence of an extreme value in a given month was identified as SST extreme event. Subsequently, the events that occurred more or equal to three months consecutively were highlighted to determine persistence, which may be associated with important events of the long-period phenomena analyzed. Finally, to compare the behavior of the SSTA with long period phenomena , annual moving average of the series of SSTA with indices PDO, AO and number of sunspots (SUN) -as solar cycle activity index- were calculated. Subsequently SSTA values with each of these indices were compared using wavelet coherence with MATLAB tool given by [13].
III. Results
The SSTA values for each hydrographic station are in Fig. 2., There is possible to detail that the station with the highest SSTA oscillation amplitude is Bahia Solano, followed by Tumaco, then Gorgona Island and finally the oceanic island of Malpelo, revealing different behavior of SST at each station, mainly due to differentiable characteristics given in the CPO [14]. Where the effect of proximity to the continent of the hydrographic stations is very important. Particularly, considering that Solano Bay is located in an area where the contribution of rain and inland waters is significant [15]. With concern to Malpelo Island, the fact that it is located in an area with more oceanic features, allows a SST behavior more uniform [16]. However, periods with similar behavior of SSTA between stations were also identified; as an example these stations share the cold periods of 1968-1970, 1973-1977, 1985-1986 and warm periods of 1965-1967, 1969, 1972-1973 1982-1983 1986-1987 1997-1998 2009-2010 2014-2015.
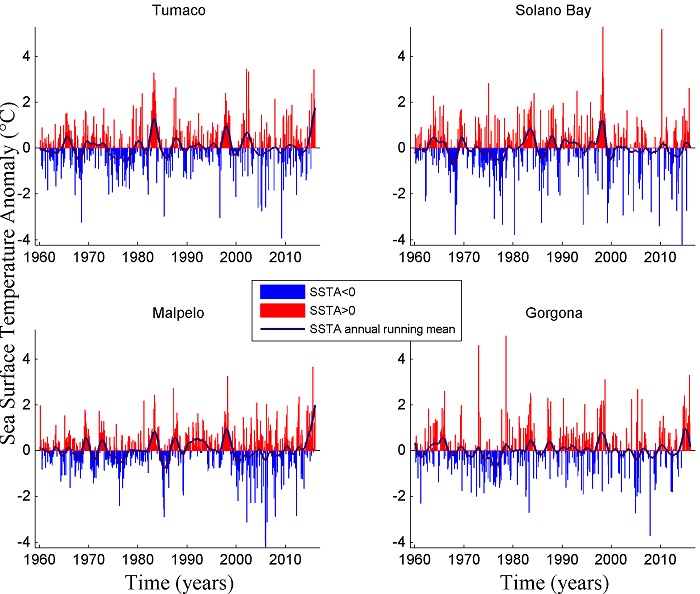
Fig.2. Sea Surface Temperature Anomalies in the hydrographic stations and their annual running mean.
The values of annual moving averages of SSTA in hydrographic stations, along with indexes ONI, PDO, SUN and AO are in Fig. 3. There was possible to see that in the study period the behavior of SSTA is subject to the behavior of ONI index. Followed by the PDO index, which highlights the significant positive SSTA values can be found when the ONI and PDO are in phase; for example, during warm periods of 1982-1983, 1997-1998 and 2015-2016 and cold periods of 1986 and 1999. Concerning the Solar Cycle, it was observed that SSTA can be found modulated by behavior the activity of the sun, especially in cold periods; for example, in 1985-1987 and 1975-1977 periods 2005-2010 in which negative values are observed SSTA, meanwhile AO show a opposite behavior with SSTA in some periods, an example is the period 1975 -1977. In the analysis of wavelets it was evident that in all stations and in much of the study period the ONI and SSTA show high coherence with a direct relationship. The stations studied, which presented greater coherence between the SSTA and of long-period phenomena indexes in the wavelet analysis was the station of Malpelo (Fig. 4). Taking this station as an example, the wavelet has shown great coherence between ONI and the SSTA throughout the study period for cycles from 24 to 64 months, according to the characteristic period of the ENSO cycle (Fig. 4 (a)). Between the PDO index and SSTA a great coherence was observed since 1985 (Fig 4 (b)). About Solar Cycle, important values of coherence were observed in the period 1960-1985 for a characteristic cycle of 11 years (Fig. 4 (c)). For AO index, greater coherence with SSTA can be seen for cycles from 16 to 64 months; mainly between 1965 and 1976, with a predominantly inverse behavior (Fig. 4 (d)).
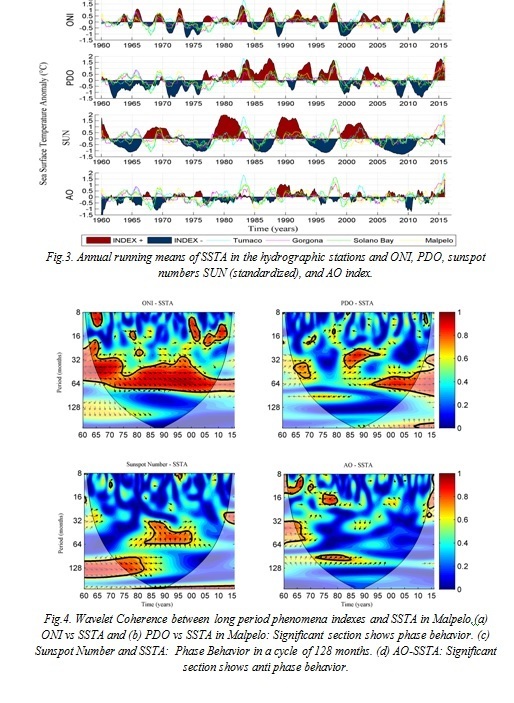
The maximum and minimum absolute values of SSTA in the study stations are in Table 1. There can be seen that the maximum absolute values in all stations were presented at events El Niño or positive phase of ENSO; 1978-1979 in Gorgona Island, 1997-1998 in Solano Bay, 2002-2003 in Tumaco and 2015-2016 El Niño for Malpelo Island, which are the years in which El Niño was moderate to strong (Fig. 3). For the absolute minimum of SSTA no direct relationship with the ENSO oscillation was observed, these values could be driven by high frequency phenomena such as the American monsoon or Madden-Julian oscillation; or regional processes such as activity wind gap of Panama or Chocó’s low level jet, phenomena that can influence the variability of SSTA in the CPO.
Table 1. Absolute minimum and maximum of Sea Surface Temperature Anomalies
|
Hydrographic Station |
Absolute min. SSTA |
Date |
Absolute Máx. SSTA |
Date |
|
Tumaco |
-3,93 |
March 2009 |
3,45 |
January 2002 |
|
Gorgona |
-3,71 |
October 2007 |
5,01 |
July 1978 |
|
Solano Bay |
-4,23 |
April 2014 |
5,27 |
March 1998 |
|
Malpelo |
-4,21 |
December 2005 |
3,64 |
July 2015 |
For each hydrographic station, Fig. 5 shows the number of extreme events per year, only considering the occurrence of extreme values from three or more months a year. In general it was observed that the number of cold events is greater than number of warm events for all the stations, except for Gorgona island station. It is also possible to detail in Fig. 5 that along time the occurrence of cold events are declining.
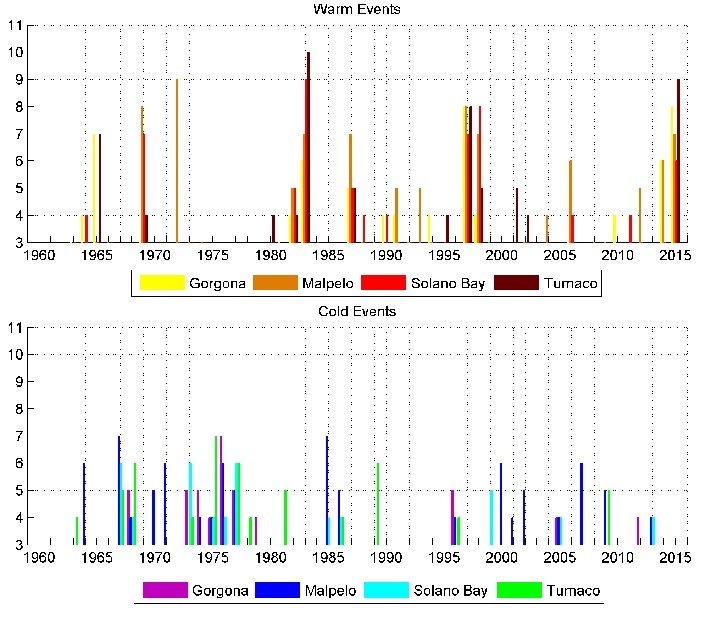
Fig.5. Number of warm and cold events.
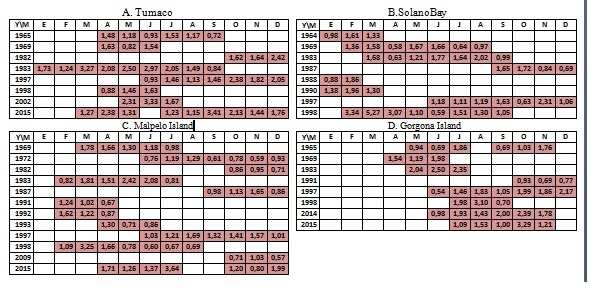
As for the warm events are concerned, in Fig 5 the effect of El Niño events in 1982-83 1997-98 and the most recent 2015-16 is shown, there the number of events per year in all the stations were greater than six, moreover given the evidence of the relationship between the ONI and the PDO index with SSTA also with ONI and PDO with significant positive values and being both in phase as is showed in Fig.3., is very likely that these phenomena were precursors of the occurrence of such important warm events. Furthermore, as is shown in Tables 2-A.and 2-D., these phenomena could cause the occurrence of consecutively extreme values of SSTA with magnitudes close to or above 2°C (Fig.1.).
It was also noted that for the period of 1987-88 the number of warm events did not exceed the value of 5 (except for Malpelo island) and only were persistent in Malpelo Island and Bahia Solano (Table 4-B. and 4-C.) when a El Niño event (strong) was held together with a positive phase of PDO as its seen in Fig. 3, but in that time solar activity was at its minimum, which could indicate an effect of attenuation or modulation of a positive phase PDO with El Niño on the SSTA in the CPO.
A similar behavior was observed in the year of 1969 with a number persistent of warm events in all hydrographic stations in a context of El Niño together with the positive phase of PDO, but with the solar cycle at its peak in addition to a possible contribution from the negative AO phase, taking into account the reverse behavior that has showed the SSTA in that period.
Other periods in which a large number of warm events in some of the stations had to correspond mainly to the weak or moderate El Niño events in lag phase with the another oscillations; in 1964/65 with negative phase of AO (favoring an increased SST) and others in a negative phase, in 1990-1995 the effect of the solar cycle in the first two years and then with the PDO detailed. The events of 2009-10 were shown in a context of moderate El Niño with a negative phase of the PDO, meanwhile in 2014 related to a positive phase of the PDO. Finally in the period 2001-02 a particular situation in Tumaco station was observed, with a heating season probably due to a regional atmospheric or oceanographic process.
Table 2. tree or more consecutive SSTA (°C) values of warm events at the hydrographic stations.
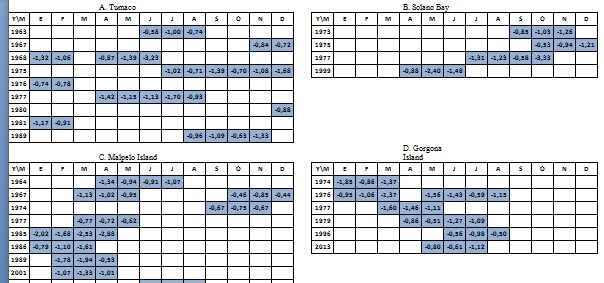
Cold events, unlike the warm events did not always had a direct relationship only with the negative phase of ENSO cycle (La Niña) as can be seen in Fig. 3. Is underlined that these events in all hydrographic stations occurred with large number and persistence in the 1967-68 and 1973-1977 periods (Fig 5, and table 3), which may be driven by the combination of several factors, among which seem relevant the AO and the solar activity.
In the first period of 1967-68 in addition to a weak La Niña, the PDO was in negative phase and AO in positive phase (Fig. 3.), since that in these periods these fluctuations played an important role in the behavior of the SSTA, it’s possible to infer that all these conditions together contributed to the cooling of surface water in the CPO. However, no persistence was observed (Table 3), which could be due to the modulation by the solar cycle.
In the second period from 1973 to 1977, all the conditions were favorable for cooling processes; Strong La Niña, PDO in negative phase, positive phase of AO and a solar cycle close to its minimum, that together could induce to shows the SSTA with negative values at hydrographic stations, where persistent occurrence were observed with important values, even lower than -1.6°C in some cases recorded at stations near the continent (Table 3).
The following cold periods at several stations were evidenced: between 1985 and 1986 with a moderate La Niña and a solar minimum, 1996 with a weak to moderate La Niña and peak solar minimum, and 2005 when it was not possible to find a clear relationship with the phenomena studied in the present study and the SSTA. For other years, when several number of cold events were recorded, it was observed that those values may be associated with La Niña events but whose response in each of the stations study were given in an isolated manner (Fig. 3-4 and Table 3).
IV. Conclusions
From the above results it is concluded that in the study period, the occurrence of extreme events of sea surface temperature is closely related to the behavior of long period phenomena considered in this study (mainly ENSO and PDO, the solar cycle and the AO were next).
In particular it is emphasized that depending on whether these phenomena are simultaneously in phase or not, the occurrence and magnitude of extreme events of SST is higher or lower. As the main precursor phenomenon of extreme events in the hydrographic stations, the ENSO oscillation was identified.
For warm events it was found that their occurrence is mainly determined by events positive phase of ENSO or El Niño; of these, the extreme events occurred in greater numbers and persistently when El Niño was found in phase with the positive phase of PDO, as occurred in the periods 1968-1969, 1982-1983, 1997-1998 and 2015-2016.
In cold events of SST besides La Niña the solar cycle also had an important role in influence the magnitude and number of events in 1973-1977, 1985-1986 and 1996 periods which minimum solar activity was observed; AO contribution was also evidenced in cooling processes for isolated periods (1967-1968 and 1975) identified by the inverse behavior of its index with SSTA at hydrographic stations.
Also there were other events that probably were not related to the phenomena analyzed in this study. These events might occur by influence of some other high frequency phenomena or regional oceanographic and atmospheric processes.
1. C. B. Field, V. Barros, T. F. Stocker, Q. Dahe, and D. J. Dokken, “Special Report on Managing the Risks of Extreme Events and Disasters to Advance Climate Change Adaptation (SREX)”, Intergovernmental Panel On Climate Change, Cambridge University Press, 2012.
2. M.J. Deflorio, Michael J., et al., “Western US extreme precipitation events and their relation to ENSO and PDO in CCSM4,” Journal of Climate, vol. 26, no 12, pp. 4231-4243, June 2013.
3. G.P. Podestá and P.W. Glynn, “Sea Surface temperature variability in Panamá and Galápagos: Extreme temperatures causing coral bleaching,” Journal of geophysical research, vol. 102, p.p. 749-759, July 1997.
4. LA RED, “DesInventar. Sistema de Inventario de Desastres,”2000.
5. L.J. Otero, J.C. Ortiz-Royero, J.K. Ruiz-Merchan, A.E. Higgins, S.A. Henriquez, “Storms or cold fronts: what is really responsible for the extreme waves regime in the Colombian Caribbean coastal region?” , Nat. Hazards Earth Syst. Sci., vol. 16, p.p. 391-401, February 2016.
6. D. Hernandez-Deckers, N.L. Villegas, I. Málikov, “Respuestas de las temperaturas superficial del mar y del aire de la Cuenca del Pacífico Colombiano producidas por el Niño Oscilación del Sur” EIDENAR, Decembrer 2008.
7. C. Amante and B.W. Eakins, “ETOPO1 1 Arc-Minute Global Relief Model: Procedures, Data Sources and Analysis,” NOAA Technical Memorandum NESDIS NGDC-24. National Geophysical Data Center, 2009.
8. “Physical Sciences Division,” ESRL News, Accessed January 22, 2016, http://www.esrl.noaa.gov/psd/data/gridded/data.coads.1deg.html.
9. “Climate Prediction Center - Monitoring & Data: Ocean Niño Index Changes Description,” Climate Prediction Center - Monitoring & Data: Ocean Niño Index Changes Accessed January 22, 2016, http://www.cpc.ncep.noaa.gov/products/analysis_monitoring/ensostuff/ONI_change.shtml.
10. "Pacific Decadal Oscillation (PDO)," JISAO, Accessed January 22, 2016, http://research.jisao.washington.edu/pdo/. "Arctic Oscillation (AO)," JISAO, Accessed January 22, 2016, http://jisao.washington.edu/ao/.
11. “NASA/Marshall Solar Physics,” Accessed January 22, 2016. http://solarscience.msfc.nasa.gov/SunspotCycle.shtml.
12. Y. Xue, T.M. Smith, R.W. Reynolds, “Interdecadal changes of 30-yr SST normals during 1871-2000,” Journal of Climate, vol. 16, no 10, pp. 1601-1612, 2003.
13. A., Grinsted, J. C., Moore, and S. Jevrejeva, “Application of the cross wavelet transform and wavelet coherence to geophysical time series,” Nonlinear processes in geophysics, vol. 11, no 5/6, p. 561-566, 2004.
14. J. L. Moreno, “Identificación de masas de agua horizontales y verticales como base para la localización de estaciones de monitoreo océano atmosférico en la cuenca del pacífico colombiano,” Investigación biodiversidad y desarrollo, vol. 29, no 1, 2010.
15. Poveda, G., & Mesa, O. (1999).” “La corriente de chorro superficial del Oeste (" del Chocó") y otras dos corrientes de chorro en Colombia: climatología y variabilidad durante las fases del ENSO,” Revista Académica Colombiana de Ciencia, vol. 23, no 89, pp. 517-528, 1999.
16. A. Devis, I. García, I. Málikov, y N.L. Villegas, “Compilación oceanográfica de la cuenca Pacífica colombiana,” Centro Control Contaminación del Pacífico Colombiano. Ed. DIMAR. Serie Publicaciones Especiales, vol. 1. , 2003.
