


BISAC NAT010000 Ecology
BISAC NAT045050 Ecosystems & Habitats / Coastal Regions & Shorelines
BISAC NAT025000 Ecosystems & Habitats / Oceans & Seas
BISAC NAT045030 Ecosystems & Habitats / Polar Regions
BISAC SCI081000 Earth Sciences / Hydrology
BISAC SCI092000 Global Warming & Climate Change
BISAC SCI020000 Life Sciences / Ecology
BISAC SCI039000 Life Sciences / Marine Biology
BISAC SOC053000 Regional Studies
BISAC TEC060000 Marine & Naval
Recent gas discoveries in the eastern Mediterranean Sea have led to multiple operations with substantial economic interest, and they are accompanied by the risk of oil spills and their potential environmental impacts. In this this study we compute the probability of an area being polluted by oil. The first stage of this computation is to determine what the likely scenarios for oil spills are, where the areas of higher oil spill probability are and what the expected size of the spill is. This study was performed as part of the RAOP-MED project, which considered ship collision scenarios, other accidental spill from ships and rigs, and accidents that might occur during fueling operations. The results of the project include a map of oil spill probability for the eastern Mediterranean that details different scenarios, as well as a map of the maximal spill size. We use these results to create possible oil spill scenarios and run Monte-Carlo simulations of the oil spill’s fate. The simulations use the MEDSLIK oil spill propagation model, forced by the realistic atmospheric and oceanic conditions that exist off the Israeli coast, as outlined by the SKIRON and SELIPS numerical models. Potential risk sources in the area are the ship traffic that enters and leaves the Suez channel, as well as the offshore platforms on the Nile Delta and in the Israeli exclusive economic zone. We also examine the impact of the alongshore current on the probability and severity of the pollution.
oil spill, Suez Canal, risk, Mediterranean Sea, pollution
I. Introduction
A major conclusion of the RAOP-MED project has been the evaluation of probability of oil spill events that are the result of maritime accidents in the Eastern Mediterranean. The considered events include, among others, collisions between two vessels or between a vessel and an offshore platform. The high probability areas (Fig. 1) were identified as being related either to individual offshore rigs, or to main traffic routes. Potential spill events related to offshore platform have been studied in the eastern Levant [1] [2] [3]. This research, however, aims to estimate the contribution of traffic density to oil contamination probability. The densest of the traffic routes is the one leading away/to the Suez Canal. Additionally, Fig. 2, which displays the maximal possible spill size (Excluding oil well blowout events), indicates that this route is also susceptible to the largest spills from oil tankers collisions. We therefore focus on the probability of a major oil pollution in the Israeli coastal waters that results from an oil spill in the vicinity of the Suez Canal on the route leading away from Port Said.
.jpg)
.jpg)
Fig. 2 Maximal potential oil spill as computed in RAOP-MED.
Regional Wind and Ocean Currents
The weather in the south eastern Mediterranean is characterized by 6 major synoptic systems [7]:
Cyprus lows - winter low pressure storms whose center travels east in the northern part of the basin. The winds southeast of the center are southerly to easterly winds, whereas strong westerlies blow west of the cold front.
Persian trough is a persistent weather system occurring during summer. It is characterized by westerly winds near Israel.
Red Sea trough (RST also known as Sudan trough) - this trough extends north from the Red Sea during the cold season. The axis of the trough separates the easterly wind east of it from the northerly wind west of it. The position of this axis, east or west of the coastline, greatly determines the coastal weather.
Sharav lows or khamsin lows, which are common in spring, are thermal low pressure systems whose center travels east along the southern coast of the Mediterranean. They induce easterly winds over the sea east of their center and north-westerly wind west of their center.
Siberian high, is a system which is usually characterized by northerly winds along the Israeli coast.
Subtropical high, is a system which is usually characterized by calm weather.
A major feature in the circulation at the sea surface of the south-eastern Mediterranean Sea is a cyclonic along-slope current flowing over the shelf and slope areas [8]. This current is persistent throughout most of the year, though it may be interrupted by episodes of southward flow. Suggested causes of such episodes include strong easterly and northerly winds typical to the RST, as well as the influence of off-shelf anticyclonic eddies [8]. The maximal velocity is usually attained during summer or during storm events (values as high as 1 m/s have been observed during winter [9]).
II. Methods
The total probability P(x,y) of a bin centered at longitude x and latitude y being contaminated, is given by the formula for conditional probability
 (1)
(1)
In which ω is an oil spill event with probability P(ω), P(x, y |ω) is the conditional probability of contamination. The total probability was computed by taking ω as the event of an oil spill at one release point and summing the probabilities over all release points. The following section discuss how the probabilities were estimated.
Oil Spill Probability
Oil Spill events in (1) were considered on release points where, according to RAOP-MED results, the ship-ship collision probability was higher than 1% per year. The assumption was made that every collision leads to an oil spill, so P(ω) was taken as the collision probability. In the RAOP-MED project, the probability of a collision with another ship or with an offshore platform was approximated using the Macduff model [4] [5] [6]. Collision probability per area in this model was given by the equation:
 , (2)
, (2)
where P is the total collision probability in the area A; Pc is the causation probability (i.e., the probability of not preventing an event); s runs over different ship types, Ns(A) is the average number of ships of type s that are present at the area A at a given time; Ls is the average length of the ships of type s; Xs(A) is the length of the ship’s path in the area A, taken as the diameter of the area; D(A) is the average distance between ships which are assumed to be travelling on a single line along the diameter of A. An overestimation of the collision probability was made by assuming it is a head on collision. The factor of two is used to mitigate the double counting of collision candidates.
In order to compute Ns(A) and D(A) in (2), traffic density information is required. Since Automatic Identification System (AIS) data was not available to the project members, traffic density was estimated from an analysis of a global dataset of Port Calls. The analysis assumed that ships travel in the shortest route at constant speed. Traffic densities were computed for different ship types over a grid of 0.1 degree resolution. Eq. (2) was then computed for each grid cell with A taken as the grid cell area.
Conditional Probability of Contamination Analysis
The methods used in this study are the same as the ones presented in [3]: we performed numerical Monte-Carlo simulations of oil spill events in order to estimate the probability of different areas being polluted by oil. The possible synoptic weather and ocean current patterns, which influence the trajectory of the oil slick, were approximated by sampling the time of the initial spill at constant intervals from a year of atmospheric and ocean forecasts. Specifically, we used the SKIRON operational atmospheric forecasting system and the SELIPS circulation forecasts from September 2012 to August 2013 to provide wind and currents to the MEDSLIK oil spill model [10]. Cutting off in August was motivated by the low variability in the atmospheric forcing during this time. A Description of the Models used can be found in [3].
Each spill event was simulated separately as an event in which oil is released instantaneously at a specific point and then flows for 15 days. The location of the oil slick was extracted every 3 hours and re-sampled from a grid with bin size of 100 m x 100 m to a uniform global grid with bin size of 1 km x 1 km. This grid was set in the region east of 32.5E. The domain is smaller than the whole SELIPS model domain. But allows us to focus on the Israeli coastal area. The release points in the Port Said area are fairly close to the eastern boundary of the model domain, however, this boundary is usually located upstream of the alongshore current. Cases in which the flow is reversed (i.e. directed west), have reduced impact on the coastal area of Israel.
Spill events were created at each release point every 36 hour during one year period. The American Petroleum Institute gravity used was 31.1 which is roughly between light and medium crude oil. The simulation consists of a single instantaneous release of 45,000 tons of oil. The amount of oil should not be critical to the probability estimations since the way Medslik manages the oil motion in parcels is more dependent on the number of parcels (we used 10,000) and the circulation patterns than on the volume in each parcel. In addition the probability calculation does not impose a concentration threshold and is therefore independent of the oil volume per parcel.
The conditional probability of contamination was estimated as the number of simulations released from a single release point, in which the bin was contaminated (at any time point during the simulation), divided by the total number of simulations from that release point.
In order to examine the seasonal changes in conditional probability, we have subdivided the events according to the date of the initial spills. The date groups are winter: January to March; spring: April to June; summer: July to September and fall: October to December. The event probability, P(ω) in each season was assumed to be evenly distributed in time.
III. Results and Discussion
The Contamination probability distribution is displayed in Fig.3-Fig.7
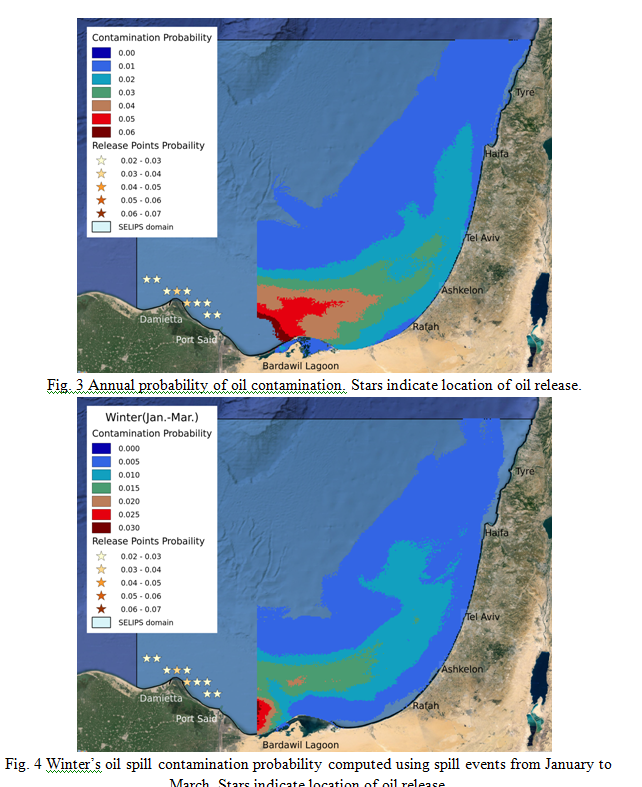
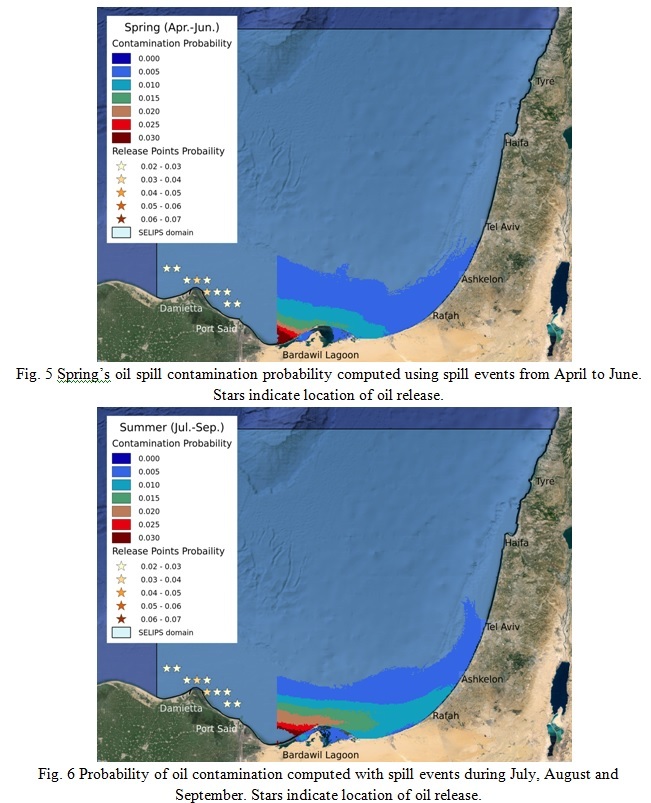
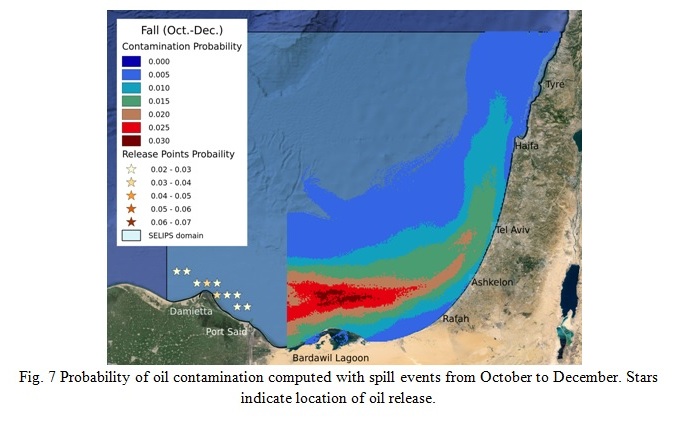
The annual probability of contamination from the release points is between 1% and 3%. That is at most three events per century (Fig. 3). The area most likely to be impacted is the southern and central coast of Israel. Examination of the seasonal component indicates that during summer and spring pollution is more likely to beached on the Egyptian coastline between the Nile Delta and Bardawil Lagoon than to be carried by the along shore current. During spring this may be due to easterly and northerly winds which are part of either RST or Sharav weather systems, and during summer due to the north-westerlies occurring over the Egyptian coast. During winter, the higher contamination probability is located about 30 km offshore which indicates that the oil spills are likely to blocked from the coastal area by the along-slope jet as discussed in [3].
The preliminary results presented provide insight into the risk created by the dense traffic lane to the Israeli coast located downstream from it. Clearly, the results need to be expanded. Doing so will require an extension of the SELIPS model domain to allow us to see how sources west of the current domain can impact the risk of oil pollution in the Israeli coastal and exclusive economic zones.
The recent expansion of the Suez Canal is planned to almost double the amount of traffic passing in the canal [11]. The impact of doubling the traffic on the risk of oil spill can be estimated by reexamining the computations of the Macduff model (2): Doubling the number of ships will double Ns(A), D(A) will be halved since the ships are all arranged on a single line. Therefore the probability will be multiplied by a factor of 8. This change in order of magnitude for the contamination probability will require the attention of Egyptian and Israeli authorities.
1. T.M. Alves, E. Kokinou, G. Zodiatis, R. Lardner, C. Panagiotakis, and H. Radhakrishnan, “Modelling of oil spills in confined maritime basins: The case for early response in the Eastern Mediterranean Sea,” Environmental Pollution, vol. 206, pp. 390-399, 2015.
2. S. Brenner, “Oil spill modeling in the southeastern Mediterranean Sea in support of accelerated offshore oil and gas exploration,” Ocean Dynamics, vol. 65, pp. 1685-1697, 2015.
3. R. Goldman, E. Biton, E. Brokovich, S. Kark, and N. Levin, “Oil spill contamination probability in the southeastern Levantine basin,” Marine pollution bulletin, vol. 91, pp. 347-356, 2015.
4. M. Przywarty, “Models of ship-ship collision. Qualitative assesment,” 18 Scientific Journals of the Maritime University of Szczecin, vol. 18 pp. 128-135, 2009.
5. A. Mazaheri, J. Montewka and P. Kujala, “Modeling the risk of ship grounding - a literature review from a risk,” WMU Journal of Maritime Affairs, December 2013.
6. L. Suyi, M., Qiang, and Q. Xiaobo, “An overview of maritime waterway quantitative risk assessment models,” Risk Analysis, vol. 32, pp. 496-512, 2009:.
7. P. Alpert, I. Osetinsky, B. Ziv, H. Shafir, “Semi-objective classification for daily synoptic systems: application to the eastern Mediterranean climate change,” Int. J. Climatol. vol. 24, pp. 1001-1011, 2004.
8. Z. Rosentraub, S. Brenner, “Circulation over the southeastern continental shelf and slope of the Mediterranean Sea: direct current measurements, winds, and numerical model simulations,” J. Geophys. Res. Oceans, vol. 112, 2007
9. Z. Rosentraub, A. Anis, R. Goldman, “Wintertime cross shelf circulation and shelf/slope interaction off the central israeli coast,” In: Rapp. Comm. Int. Mer Medit., p. 171, 2010
10. R. Lardner, Medslik v. 5.3.1 User Manual, Oceanography center, University of Cyprus, 2009
11. “New Suez Canal project proposed by Egypt to boost trade,” Cairo News.Net. Retrieved 7 August 2014.