


Marine Hydrophysical Institute of RAS
Russian Federation
BISAC NAT010000 Ecology
BISAC NAT045050 Ecosystems & Habitats / Coastal Regions & Shorelines
BISAC NAT025000 Ecosystems & Habitats / Oceans & Seas
BISAC NAT045030 Ecosystems & Habitats / Polar Regions
BISAC SCI081000 Earth Sciences / Hydrology
BISAC SCI092000 Global Warming & Climate Change
BISAC SCI020000 Life Sciences / Ecology
BISAC SCI039000 Life Sciences / Marine Biology
BISAC SOC053000 Regional Studies
BISAC TEC060000 Marine & Naval
Working with satellite data, has long been an issue for users which has often prevented from a wider use of these data because of Volume, Access, Format and Data Combination. The purpose of the Storm Ice Oil Wind Wave Watch System (SIOWS) developed at Satellite Oceanography Laboratory (SOLab) is to solve the main issues encountered with satellite data and to provide users with a fast and flexible tool to select and extract data within massive archives that match exactly its needs or interest improving the efficiency of the monitoring system of geophysical conditions in the Arctic. SIOWS - is a Web GIS, designed to display various satellite, model and in situ data, it uses developed at SOLab storing, processing and visualization technologies for operational and archived data. It allows synergistic analysis of both historical data and monitoring of the current state and dynamics of the "ocean-atmosphere-cryosphere" system in the Arctic region, as well as Arctic system forecasting based on thermodynamic models with satellite data assimilation.
Arctic, web GIS, remote sensing, monitoring, forecasting, satellite data, modeling, synergistic analysis, data archives, interactive visualization
I. Introduction
Continuous intellectual analysis of the Ocean-Atmosphere-Cryosphere system state of the Arctic region is impossible without operational satellite monitoring by space remote sensing systems in different ranges of the electromagnetic spectrum with the extraction of maximum information from observational data and its correct interpretation.
High latitudes naturally increase spatio-temporal coverage of polar-orbiting space crafts. An expected large positive impact to manage the Arctic environment is thus foreseen:
- in supporting localization and operation of future offshore energy plants and marine harvesting sites,
- as well as ongoing and planned national monitoring and surveillance programs,
- oil spills detection,
- ice dynamics,
- storm watch.
Working with satellite data, has long been an issue for users, which has often prevented from a wider use of these data because of Volume, Access, Format and data Combination. Nowadays, there are many resources that provide access to satellite data, but most of them have significant limitations: the provision of access to the original files without prior imaging of their contents, lack of search flexibility, etc.
Therefore, the idea of the work is to build a system which primary purpose would be to solve the main issues encountered with satellite data: Volume, Access, Format and data Combination. Finally provide users with a fast and flexible tool to select, analyze and extract products within massive data diversity that match exactly its needs or interest. As this article shows, the Storm Ice Oil Wind Wave Watch System (SIOWS) designed by the Satellite Oceanography Laboratory (SOLab) of the RSHU is an excellent tool for such a workflow.
II. Concept and architecture
SOLab SIOWS is a single page web-GIS application. It is designed to display various satellite, model and in situ data with general concept of data efficiency and representability. It uses developed at SOLab storing, processing and visualization technologies for operational and archived data. Generally, it is the (front-end) interface between the user and the data access layer (the back-end). Altogether, the front-, the back-ends and the server infrastructure represent the SATellite Data Search and Manage INformation Portal (SATIN), as schematic diagram in Fig. 1 shows. SATIN is capable of handling a variety of data formats and types, protocols and origins, including in situ and model data from local, remote, commercial and open access data repositories.
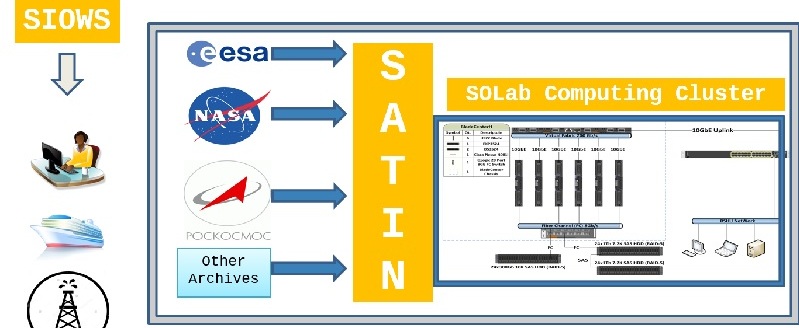
Fig. 1. Schematic representation of users accessing data from the back-end of the SATellite Data Search and Manage INformation Portal (SATIN) through the SIOWS front-end.
Flowchart in Fig. 2 shows the technical aspects of the SATIN. As one can see, the system is fairly complicated and consists of several major services. Further, we will briefly describe main services of the SATIN and give more detail on the Arctic Portal, build on top of the SOLab SIOWS.
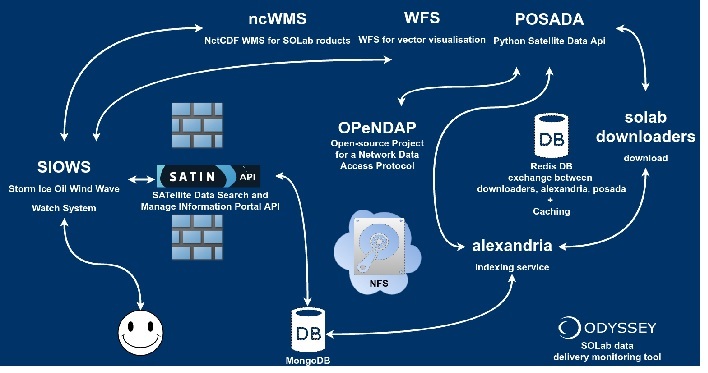
Fig. 2. SATellite Data Search and Manage INformation Portal (SATIN) flowchart.
SIOWS
The architecture of the SOLab SIOWS single page web-GIS application is designed accordingly to the Reactive Programming concepts declared by Reactive Manifesto (http://www.reactivemanifesto.org). Basic points of the manifesto are responsiveness, scalability, resilience and message-driven approach. To implement that, we used NodeJS technology and particularly React library which was initially created by Facebook to build large applications with data that changes over time.
Business logic (which means a set of rules which describe particular domain area) is implemented with the Flummox library, which in its turn implements Flux architecture approach. The approach describes how to divide an application to layers and define data flows:
- View layer turns data into HTML (DOM);
- Store layer keeps loaded data and current application’s state;
- Actions represent application’s logic;
- Dispatcher delivers messages from Actions to Stores.
The main advantage which Flux brings into the application is one-way data flow: messages go from Views to Actions, from Actions to Dispatcher, from Dispatcher to Store, from Store to Views. That allows simplifying complex architectures and significantly helps in creation of scalable solutions.
To display data on a map we use the latest third version of the OpenLayers library. Previous version was very popular and proved its reliability and convenience in cases of displaying geospatial data. Developers of the OpenLayers 2 considered all previous issues to create a better, improved version.
SATIN data catalog
SATIN has its own data catalog with a web interface (http://satin.rshu.ru). All the data is accessible through web with use of HTTP, FTP or OPeNDAP. For the moment, SATIN data catalog contains over 30 pre-selected model, in-situ and satellite products of sea surface temperature, sea ice concentration, wind, altimetry and many others. All the data is stored on NFS drives organized in RAID.
SATIN API
SATIN API - is an application-programming interface. The SATIN API is necessary for data exchange between different services of the SATIN. It is responsible for the search and delivery of the information based on the index of the products in the format requested from the SIOWS web-GIS portal. The API provides information about supported media formats of the specific products, list of available products, data and time ranges, it finds the nearest granule to the requested date, a list of granules for the requested range etc. The API is developed in Python using Flask library, SQLAlchemy, arrow and others. The indexes of the granules, products and other service information are stored in a PostgreSQL database. API provides specification in a format compatible with swagger 2.0. Results of the API request are returned in JavaScript Object Notation (JSON) format. To speed up execution of the requests to SATIN API the results are cached in REDIS (REmote DIctionary Server).
POSADA
POSADA stands for Python Satellite Data Api – is a service, which is responsible for downloading, processing satellite data and both image and quicklooks generation for the SATIN web data catalog and SIOWS. POSADA can be run in automatic and manual modes. POSADA consists of two main modules: module for downloading data and module for data processing.
Module for downloading data implements automatic downloading of data from external data sources. There is a set of tasks and configuration files for each data source and type. Data downloading initialized by cron daemon. Initialization process runs a script, which determines the relations between tasks, configuration and data types.
Communication between modules and external services is implemented using key value REDIS storage. POSADA has a logging system, which logs all events: from product downloading initialization to granules processing. In addition, POSADA sends reports about all downloaded and processed data to the ODYSSEY service.
ODYSSEY
ODYSSEY – is a data delivery monitoring tool, which collects actual logs from POSADA and Alexandria indexing service. The purpose of this service is to control and monitor products state, based on information received from POSADA, SATIN API and SIOWS. ODYSSEY performs tracking of individual products processing states based on the fixed timetable. This timetable sets the time period, during which the product should be processed and made available for the SATIN API consumers. If in the end of selected period data is not available, ODYSSEY notifies developers about such an instance, which allows developers to be able to respond to problems quickly and effectively.
Alexandria
Alexandria – a system for indexing metadata of satellite products archives and forming requests for processing granules by POSADA system.
MongoDB (from humongous), cross-platform open-source document-oriented database) is used as a database to store metadata. Interaction with other systems is carried out using REDIS.
Interaction with the ODYSSEY data delivery monitoring tool is carried out by POST requests sent to the server http://odyssey.solab.rshu.ru.
Data reading module is handled for all products and it “listens” for REDIS message queue. Processing cycle is build with the Luigi library (Luigi is a powerful, easy-to-use framework for building data pipelines. It was developed at Spotify, where it runs thousands of jobs per day). When a new message arrives in the queue, it initializes a launch of new separate granule metadata reading process, to which the path to the granule transmits. Using the path to the granule and its name, type of product is determined and handler for metadata reading is selected. Metadata reading is implemented for datasets of various formats: GRIB, NetCDF, binary and others. Once retrieved metadata are written to the database and formed, and then message for processing granule by POSADA system is sent. Rebuilding the index dataset is done with use of the Multiprocessing Python package.
Later, granules indexes and metadata stored in MongoDB are used to display data on SIOWS portal and SATIN data catalog.
ncWMS
ncWMS – is a Python-based server application that serves up map tiles based on rendered geographic data directly from NetCDF files.
Main advantage of the ncWMS is that it maximally reduces hard drive requests, as well as allows interactive change of data presented for the user by importing data directly from the same NetCDF file. This is done by storing tiles at different zoom levels in one NetCDF in any of the uint or float formats, which also allows reducing space required for storing tiles and time needed to access them.
When request comes from the SIOWS to the server, it determines a product type, variable, zoom level, bounding box, other parameters and requested dynamic range to build a tile set which will be returned as a response. That operation does not require a complete processing of raw data, but relies on already pre-processed information, which is also stored as a NetCDF file. Therefore, it takes only a few milliseconds to rebuild tiles and return them back to the user.
WFS
Mapping of vector data (e.g., winds, currents, ice drift) in SIOWS is done with use of WFS (Web Feature Service). It is written in Pyhon making use of pygrib, scipy, numpy and pyresample libraries.
SIOWS portal sends requests to the WFS-server and recievs data in GEOJSON (spatial data exchange format based on JavaScript Object Notation (JSON)) format for displaying vector data on the portal. WFS-server can read data of different products in GRIB and NetCDF formats. For this purpose pygrib and scipy libraries are used. When the server receives a request from SIOWS, it reads the required datasets from data server. After that the server performs various processing: gridding, interpolation and data caching in REDIS (REmote Dictionary Server) to speed up subsequent data requests. Subsequent requests first check the presence of interpolated data in REDIS cache and only in the case of its absence data is read from disk. After that the data are decimated for a particular scale of map displayed on the SIOWS portal, converted into GEOSJON format and response is returned to SIOWS portal.
SIOWS portal receives the response from WFS-server in GEOJSON format and displays the data for user as vectors using OpenLayers library (Fig 3).
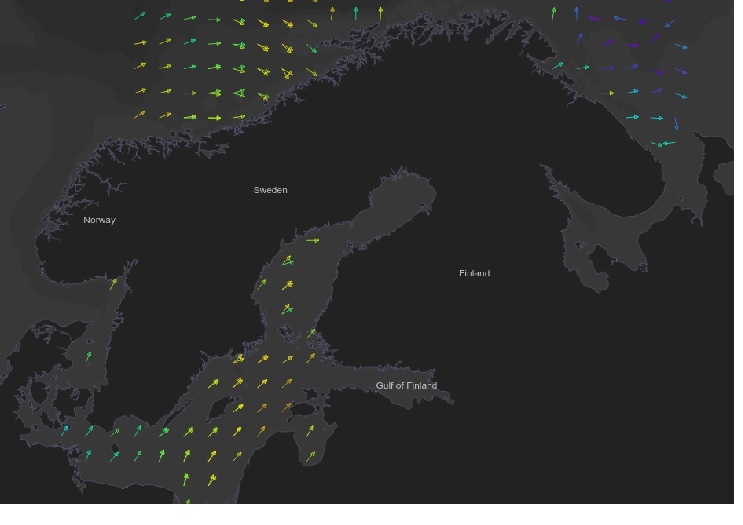
Fig. 3. Wind vectors from several ASCAT scatterometer datasets on 6 February 2016 displayed in SIOWS: Arctic Portal.
II. SIOWS: arctic portal
Arctic Portal (http://arctic.solab.rshu.ru/) (Fig. 4) build on top of the SOLab SIOWS allows synergistic analysis of both historical data and monitoring of the current state and dynamics of the "ocean-atmosphere-cryosphere" system in the Arctic region, as well as the Arctic system forecasting, based on thermodynamic models with satellite data assimilation.
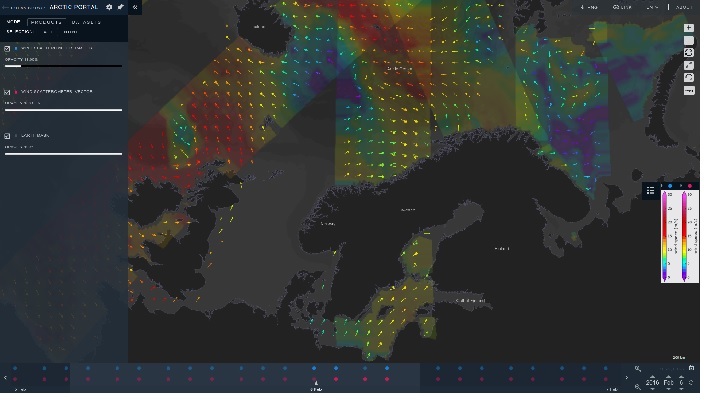
Fig. 4. SIOWS: Arctic Portal user interface with several ASCAT scatterometer datasets on 6 February 2016 displayed as raster and vector layers.
We designed the new user interface taking into account all of the previous experience. The goal was to free as much space as possible for the map and to put all extra settings into sidebars which user can hide if not needed. We also introduced a color coding in the TimeScaleBar for layers of products. The picture above shows two different ASCAT layers: raster – colored blue and vector – colored red in the TimeScaleBar.
Fig. 4 shows the left sidebar, which by default contains a list of products. By pressing the Manage Layers button user goes into a mode where he could change the layer’s settings. Among them, one could adjust the opacity, layers order and grouping, colormap and colorbar settings. If the user needs to adjust the colormap of presented data, after zooming for example, one could simply do that, as the ncWMS server allows rescaling the colormap on the fly.
Among other functionality, users can choose the date ranges, parameters of interest, map region and projection, export current map state as a PNG image with the SOLab logo and credentials. Get a shorten link to the current map state, and switch the SIOWS: Arctic Portal working language between Russian and English.
SIOWS represents model, in situ data and satellite imagery with different data types. File types include netCDF, HDF, GRIB, JSON, geoTIFF and Shapefiles.
One can manage single datasets and download corresponding data from the SATIN data catalog in many formats, as NetCDF, HDF, binary etc.
The underlying framework of the web-GIS application is React JS. It uses Redux module and methodology for data-flow control, and many other React-related libraries, such as react-canvas, for data visualization.
Arctic portal supports internationalization and intended for usage of wide audience of scientists, students, as well as oil and gas companies, national monitoring and surveillance programs and simply everyone interested in meteorology and oceanography.
III. As a conclusion
The first public release of the SATIN data catalog and the SIOWS web-GIS portal was in early 2012. While it should still be considered under heavy development and subject to changes, it has already proved its reliability and excellence for synergistic analysis, monitoring and forecasting of the Ocean-Atmosphere-Cryosphere system state, as being used by variety of students and scientists from different universities and institutions.
IV. Acknowledgments
SIOWS: Arctic Portal and SATIN wouldn’t be where they are today if it weren’t for the SOLab collaborative community’s contributions. Over the years, scientists and students have sent bug reports, ideas, and even portions of new code. Some of the more prolific contributors have become developers. It is only because of such a community that it continues to improve.
Funding for this research was provided by the Ministry of Education and Science of the Russian Federation Project through the Project RFMEFI61014X0006, agreement #14.610.21.0006
1. no references