


BISAC NAT010000 Ecology
BISAC NAT045050 Ecosystems & Habitats / Coastal Regions & Shorelines
BISAC NAT025000 Ecosystems & Habitats / Oceans & Seas
BISAC NAT045030 Ecosystems & Habitats / Polar Regions
BISAC SCI081000 Earth Sciences / Hydrology
BISAC SCI092000 Global Warming & Climate Change
BISAC SCI020000 Life Sciences / Ecology
BISAC SCI039000 Life Sciences / Marine Biology
BISAC SOC053000 Regional Studies
BISAC TEC060000 Marine & Naval
This study presents the results of field and laboratory-based experiments performed to determine the mussel density effect on an individual mollusk’s growth and clearance rates. We measured the weight and length growth rates of single and aggregated mussels exposed into the sea for three monthly periods in summer and autumn 2015. The sample group contained 140 mollusks from natural populations within the length range of 15-20 mm. The average growth rate of aggregated mussels was almost the same as the growth rate of single ones. Clearance rate of single and aggregated mussels was measured in the laboratory using indirect method. There were selected 5 groups of mussels within the length ranges: 12-16 mm, 17-18 mm, 18-25 mm, 22-23 mm, and 35-38 mm. The clearance rate was measured for each mussel from the group and then for the whole group aggregated in a clump. Water temperature and seston concentration were the same for single and clumped mollusks. The volume of water in chambers was proportional to the weight of mussels put in water. The ratio of aggregated and single mussels’ clearance rates varied from 0.48 to 0.85 at the same density of aggregation and without regard to the animal size. Significant individual variability was recorded in all field and laboratory-based experiments.
mariculture, Bivalvia, growth in aggregation, clearance rate, laboratory experiments
I. Introduction
FAO estimates that the world production of aquaculture increases almost twice every 10 years. Sustained development of aquaculture depends on effective minimizing of the mariculture harmful effect on the environment. Most of scientists agree that problem can be solved by passing from monocultures to integrated polyculture that means simultaneous cultivation of several species with different trophic level like fish, macrophytes, filter-feeders and detritophags. Cultivated species should be chosen to make excretory products of one species consumed by other species.
With the right choice of integrated polyculture components, their disposition and total weight according to the ecological capacity of the district, system comes to a balance thus minimizing any environmental impact. In fact the artificial ecosystem is created inside the natural one and it functions without making any harm. Practical biotechnology development must be preceded by creating information technology including the simulation model and the system collecting and processing information about the real system functioning [1]. Earlier we developed such simulation model including the description of the cultured mollusks and macroalgae, hydrochemical unit and comparatively simple hydrodynamic model [2, 3]. This paper reveals only one component of this model such as the unit reproducing the growth of mussel Mytilis galloprovincialis on artificial substrate [4]. Empirical relations used in this unit were obtained in the laboratory-based conditions and need to be verified to imitate the cultivated species functioning within natural environment. Dense clumps of mollusks are formed on collectors of marine mussel plantations. There are reasons to suppose that physiological functions of specimen in such aggregations differ from physiological functions of specimen in laboratory. In this connection, to have these functions described adequately in the model we have to assess the influence of aggregation and adjust the empirical relations obtained in the laboratory for isolated mussels.
Studies on physiological characteristics changes of bivalves in clumps are very limited. The process of clump-forming itself is not studied well yet. Number of researchers supposes this process to be of random nature. Their opponents claim the forming of clumps to be the result of active behavior responses of mollusks [5]. We can assume that aggregative changes in physiological processes are one of the most important reasons of aggregation forming. One of the earliest studies of aggregation impact on mollusks’ oxygen consumption rate was the research [6]. The laboratory-based experiments conducted in [6] revealed that specific oxygen consumption rate diminishes in relation to the number of mollusks in one chamber. Similar study was made in [7]. Researchers held experiments in the laboratory with the fresh-water bivalve mollusk Elliptio complanata and came to the same conclusion.
Density impact on the effective clearance rate of the bivalves was studied in [8, 9]. The authors of [8] fixed that the average effective clearance rate for isolated individuals was higher than that for those in clumps. They explain decrease of the clearance rate in dense aggregations by increased refiltration in the cores of the clumps. The results of [9] showed the significant effects of mussel density and the seston concentration on the effective clearance rate of mussels. As opposed to [8], the higher clearance rates in experiments were obtained at denser mussel clumps. The authors suppose that obtained results were connected with the high concentration of food particles used in the experiments. They hypothesized that refiltration could have an opposite effect and reduced negatively high food concentrations down to a more favorable range for less exposed mussels. But some other experiments should be carried out to check this hypothesis. Authors of [10] measured the ingestion rate in dense colonies of bivalves and came to conclusion that ingestion of mussels located within middle and bottom layers of the colony was less due to the suffering from reduced access to food resources. There were no information about ingestion or filtration abilities of a colony as a whole compared to the isolated mussels.
We failed to find another papers concerning aggregation impact on filtration and growth rates of mussels in the literature that is why we had held mussels’ growth monitoring on collectors at the nearshore zone and laboratory-based study of density influence on mussels’ filtration rate. The results of our work are described below.
II. Aggregation impact on the growth rate of mussels
Natural experiment was carried out in
Averages, standard deviations and coefficients of variation were calculated upon the results of monthly measurements of mussels’ linear and weight growth. Average growth rates of isolated mussels and those in clumps had been compared. During the first monthly period (from June, 12 to July, 13) we used plastic cages but they malformed the shells of mussels and curbed the linear growth of mollusks so the results of that period had to be rejected.
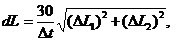
Diagrams on Fig. 1 show average linear growth rates for different periods of time. Linear growth rate of mussel was counted according to the formula:
 (1)
(1)
where L1 and L2 – length and height of mollusk’s shell, Dt – time when collectors were exposed in the sea.
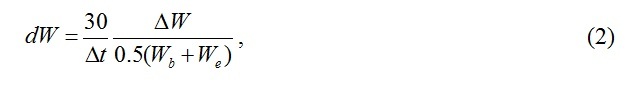
Specific weight rate was calculated upon the wet weight measurements:
 ,
,
where Wb and We – original and terminal measurement of specimen’s wet weight.
Diagrams on Fig. 2 demonstrate specific weight rates for different periods of time in comparison.
.jpg)
Fig.1. Average linear growth rates (1) in groups of isolated mussels – 1 and mussels in clumps – 2 during the time periods: a – July-August; b – August-September; с – September-November.
Diagrams on figs. 1 and 2 are qualitatively similar that proves sufficient accuracy of measuring mollusks’ wet weight (mollusks were scaled with the water inside their shells). Great intergroup variation of rates draws our attention because it means that individual living characteristics of mollusks vary greatly as conditions of mussel groups on collectors and their food supply were almost the same.
It was supposed that isolated mussels would grow faster as they are provided with oxygen and food better and do not compete with their neighbors for resources. However, comparison of average growth rates of isolated mussels and mussels in clumps didn’t give expected results.
.jpg)
Fig.2. Average specific weight rate (2) in groups of isolated mussels – 1 and mussels in clumps - 2 during the time periods: a – July-August; b – August-September; с – September-November.
Fig. 3 demonstrates linear and weight growth rates averaged for all groups and for the whole time of experiment in comparison. In the first period of the experiment linear growth rate of isolated mussels was even smaller than for aggregated mussels. Average specific weight rates of mussels almost match not depending if mussels are isolated or aggregated. The relation between isolated mussels and mussels in clumps is 0.98 for linear growth and 0.95 for specific weight growth rate.
.jpg)
The mortality coefficient of mussels m (month-1) was also under control. Fig. 4 shows the average meaning in groups of this coefficient.
.jpg)
The relation between average mortality coefficients of isolated mussels and mussels in aggregation is 1.10 (aggregated mussels – 0.066, isolated – 0.060). Considering high individual variation and limited sample we can accept a hypothesis that disposition of mussels in clumps doesn’t augment the mortality coefficient under otherwise equal conditions.
III. Laboratory study of density influence on mussels’ filtration rate
The filtration rate was estimated by the clearance rate defined as the amount of water cleared from food particles per unit of time. Microalgae Tetraselmis viridis was used to prepare food suspension for experimental mollusks. Optical density with the wave length 750 nm was used as indirect indicator of microalgae biomass. Measurements were held with photoelectric colorimeter PC-3 and a
Five samples of mollusks with similar length parameters were selected from natural populations. The size ranges within groups were: 12 –
To derive the filtration rate formula C (l∙h-1) we use the equation describing decrease of seston concentration in a chamber of volume V(l) containing n mussels [12]:
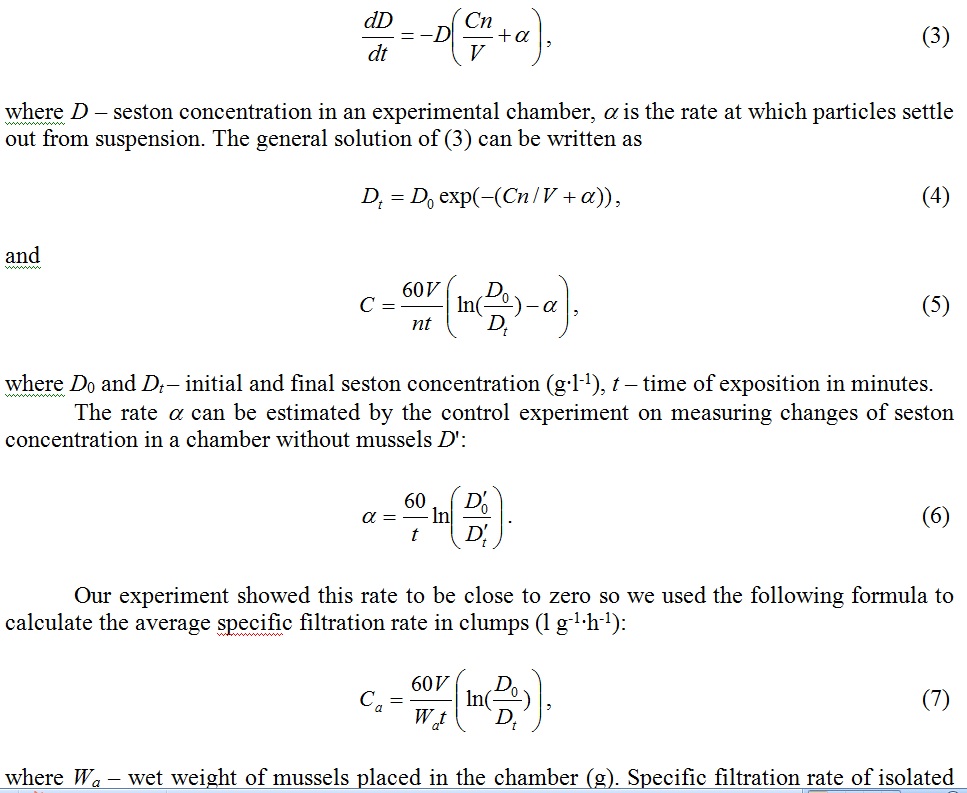
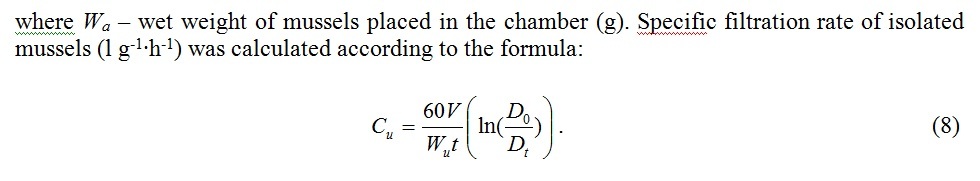
Fig. 5 demonstrates average filtration rates of isolated mussels and the same mussels joined in clumps in comparison. The relation of aggregated mussels’ filtration rate to the average filtration rate of isolated mussels turned out to be less than 1 and varied from 0.48 to 0.85. Apparently variability of this parameter was influenced by the water temperature and high individual variation of physical characteristics of mussels.
Laboratory experiments let us suppose that filtration rate of aggregated mussels is 15-50% lower than filtration rate of isolated mussels. At the same time we didn’t observe substantial decrease of the growth rate of mussels in clumps. According to the energy balance equation of living organisms, productive energy could be estimated as P = A – R – E (cal∙day-1), with А – assimilated energy, R – metabolic costs, Е – excretion energy. The assimilated energy is proportioned to the consumption I =СKdD, with C – filtration rate, D – concentration and Kd – calorific value of food suspension. In this case we can write down P = AeCKdD – R – E with Ае – assimilation coefficient.
One can write
(R + E)a < (R + E)u (9)
keeping in mind that productive energy of isolated and aggregated mussels seems to be almost equal (as it was showed by our investigation of growth rate of mussels on collectors), initial concentrations of suspension were equal, assimilation coefficients were the same (as experiment was held with the same mussels), and filtration rate of aggregated mussels was lower than that of isolated mussels.
.jpg)
Fig. 5. Relations obtained in the experiment between aggregated mussels filtration rates and the filtration rate of isolated mussels averaged for all the groups.
Excretion energy (E) is still under-explored. According to [13], excretion depends on mollusk’s weight and concentration of food particles in water. Excretion energy is smaller by an order of magnitude than metabolic costs, therefore with sufficient precision the relation (9) can be rewritten as Ra < Ru. That conclusion agrees with previously performed studies. Influence of mussels’ stocking density in a respirometer on the oxygen consumption rate was studied in [6]. At first experimental mollusks were placed in separate respirometers and then they were replaced into one big respirometer with parallel measuring of oxygen consumption. Water volume per one specimen was 312 ml for mussels in aggregations and 250 ml for isolated mussels. Fig. 6 demonstrates the results of that experiment. 80% of measurements revealed the relation Rа/Ru to be less than 1, average obtained meaning was 0.92. Experiments when aggregated mussels had half as much water volume as isolated ones showed that oxygen consumption rate of the first was sufficiently lower than that of the second. In that case average ratio Rа/Ru decreased to 0.77 [6].
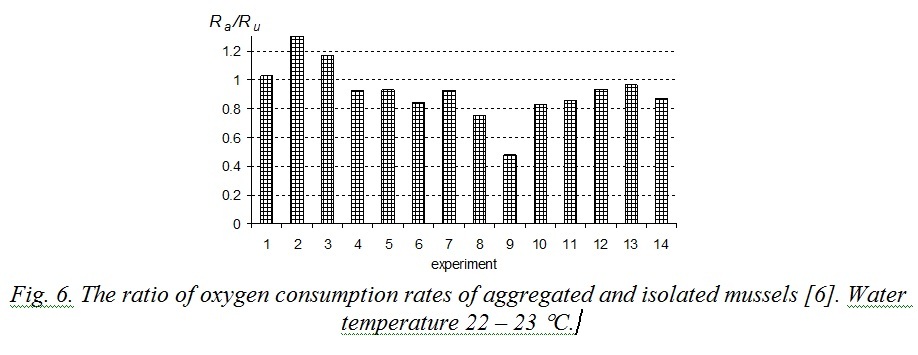
Fig. 6. The ratio of oxygen consumption rates of aggregated and isolated mussels [6]. Water temperature 22 – 23 °С.
Dependence of hydrobionts’ specific basic metabolic costs on patch density is known for many kinds of aquatic organisms (physiological activities decrease in aggregations). In the case of mussels clumps, this can be explained by the limited (comparing to the isolated mussels) life space available for a mussel in a clump to take necessary nutrients and energy from the ambient water. It’s reasonable to assume that mollusks from biofouling cenosis would experience this effect much bigger as they form very dense aggregations. Physical activity of mussels in aggregation decreases much more under the low current velocity because of metabolic products accumulation and oxygen depletion as the result of mussels’ oxygen consumption. This phenomenon must be taken into account in the simulations of mussels’ functioning on collectors of a mussel farm. It should be considered for accurate description of matter interchange between the artificial and natural ecosystems and estimation of ecological capacity of marine area planned for mariculture. To develop reliable empirical relations some additional laboratory-based experiments are needed to calculate the filtration rate and the oxygen consumption rate of mollusks under the variable environmental conditions, such as temperature, concentration of feeding suspension and the density of clumps.
1. E. F. Vasechkina, “Concept of informational technology of sustainable development support of mariculture in the nearshore zone of Crimea”, Environmental control systems, 2014, vol. 20, pp. 220-225.
2. E. F. Vasechkina, “Multi-element model of the pelagic plankton community”, Environmental control systems, 2013, vol. 19, pp. 247-252.
3. E. F. Vasechkina, “Simulation of an integrated multi-trophic aquaculture”, Proc. of Conf. MARESEDU - 2015, Moscow, MSU, October 2015, pp. 463-466.
4. E. F. Vasechkina, I. I. Kazankova, “Mathematical modeling of the growth and development of the mussel Mytilus galloprovincialis on artificial substrates”, Oceanology, 2014, vol. 54, № 6, pp. 763-770.
5. P. A. Lezin, “Peculiarities of aggregative behavior and spatial organization of mussels Mytilus edulis in the White Sea”, PhD thesis in biology, Institute of Zoology RAS, S.-Petersburg, 2009.
6. V. D. Brajko, “Dependence of mussels’ breathing on the size of respirometers”, Biologiya morya, 1979, vol. 48, pp. 15-21.
7. C. G. Paterson, “Effect of aggregation on the respiration rate of the freshwater unionid bivalve Elliptio complanata (Solander)”, Freshwat. Inv. Biol., 1983, № 2, pp. 139-146.
8. N. Yu, D. A. Culver, “Estimating the effective clearance rate and refiltration by zebra mussels, Dreissena polymorpha, in a stratified reservoir”, Freshwater Biology, 1999, vol. 41, pp. 481-492.
9. A. Zaiko, D. Daunys, “Density effects on the clearance rate of the zebra mussel Dreissena polymorpha: Flume study results”, Hydrobiologia, 2012, vol. 680, pp. 79-89.
10. N. C. Tuchman, R. L. Burks, C. A. Call, J. Smarrelli, “Flow rate and vertical position influence ingestion rates of colonial zebra mussels (Dreissena polymorpha)”, Freshwater Biology, 2004, vol. 49, pp.191-198.
11. A. B. Borovkov, R. G. Gevorgiz, “Productivity of Spirulina platensis and Tetraselmis viridis under various methods of cultivation”, Ecologiya morya, 2005, vol. 70, pp. 9-13.
12. J. Coughlan, “The estimation of filtering rate from the clearance of suspensions”, Mar. Bio., 1969, № 2, pp. 356-358.
13. V. I. Kholodov, A. V. Pirkova, L. V. Ladygina, “Functional characteristics of a typical mussel farm”, Rybnoye khozyajstvo Ukrainy, 2011, № 5, pp. 48-55.