


BISAC NAT010000 Ecology
BISAC NAT045050 Ecosystems & Habitats / Coastal Regions & Shorelines
BISAC NAT025000 Ecosystems & Habitats / Oceans & Seas
BISAC NAT045030 Ecosystems & Habitats / Polar Regions
BISAC SCI081000 Earth Sciences / Hydrology
BISAC SCI092000 Global Warming & Climate Change
BISAC SCI020000 Life Sciences / Ecology
BISAC SCI039000 Life Sciences / Marine Biology
BISAC SOC053000 Regional Studies
BISAC TEC060000 Marine & Naval
Presence of small plastic particles (< 5 mm), defined as microplastics, in the ocean and, especially, in coastal areas became evident in the last decade. From physical point of view, this fact indicates emergence of a new type of particles in the ocean. In contrast to the abundance of studies concerning sources, actual distribution and ecological effects of those particles, there are almost no detailed descriptions of physical mechanisms determining their distribution and behavior in the water column. Settling velocities of microplastics were measured in a series of experiments conducted in a 1-meter high glass tank filled with distilled water, in accordance with the typical methodology used in sedimentology. At first approximation, we supposed that the semi-empirical formulations developed for the natural sediments would be applicable to the microplastics. Results of preliminary experiments on microplastics of simple shapes justified this hypothesis. The majority of the implemented equations of settling velocity fitted well with the experimental data. Next step would be to test these formulations on the marine microplastic particles with greater variability in shapes. The research is supported by the Russian Science Foundation, project number 15-17-10020.
microplastics, settling velocity
I. Introduction
The sea and ocean waters have accumulated hundreds of thousands of tons of polymer litter (for instance, [1, 2, 3]). But the most dangerous kind of all polymers found in the ocean is microplastics – tiny particles of plastic, less than 5 mm [1, 2, 4]. Microplastics are formed when large man-made plastic objects are broken and degraded under the influence of the sun, waves or other factors. They are also ingredients of personal healthcare and beauty products which contain thousands of microscopic plastic spheres (microbeads) and fibers. An alarming feature of microplastics is the ability to effectively accumulate toxins on the their surface, which in the end get inside fish, sea animals, birds, and further on along the food chain – inside human bodies [1, 4, 5]. Not only does plastic float on the surface once it gets in the water; a large part of it sinks to the sea bed or accumulates on the beaches in the form of microplastics.
Plastic pollution in the Baltic Sea has been accumulating for years and just recently it has become obvious that only multidisciplinary approach (geographical, biological, chemical, etc.) to the issues related to the processes of transformation of properties and propagation of plastic particles will allow the study of physical aspects of the problem.
The aim of our study is to give an initial assessment of the distribution of microplastics on the beaches in the south-eastern part of the Baltic Sea (in Kaliningrad region) to show the qualitative and quantitative composition of the microplastics as well as accompanying objects (macroplastic, amber, paraffin). During the first stage of the study, samples were selected from different areas at the beaches.
Sampling sites were chosen near the distributed and point sources of plastic pollution. Preference was given to those beaches that are exposed to maximum anthropogenic pollution: areas around the town of Baltiysk, the northern part of the Vistula Spit (near the settlement of Kosa), and the Sambian peninsula coast (settlements of Yantarny, Donskoye, Primorye, Kulikovo, and towns of Svetlogorsk, Pionersky, Zelenogradsk - in the field of active recreation) as well as rather solitary locations of the coast (Fig. 1).
II. Materials and methods
There is no universally agreed definition of microplastic size, but most commonly, microplastics have been defined as synthetic organic polymer particles with a size (or, more specifically, largest dimension) <5 mm [5, 6, 7, 8]. There is little consensus on the lower size boundary [1], but most studies reported main size ranges of microplastics to be 0.5-5 mm [3, 7, 9, 10, 11]. Separation of the particles ranging in size from 0.5 to 5 mm in a special group is not accidental. It is caused by considerable technical difficulties existing in the analysis of particle sizes less than 0.5 mm [7]. In cases where sampling included microplastics, but the upper size limit of the sampled plastics is somewhat above 5 mm (e.g. 10 mm), the term ‘small plastic items’ is employed. Plastic items larger than 5 mm frequently are designated as macroplastics [8]. But also plastic particles can be classified into “meso plastic particles” (5-25 mm) and “macro plastic particles” (>25 mm) [4]. Particles in the size range 0.5-5 mm were considered as “microplastics” for the purposes of this assessment. We use the term “meso/macro plastic” for particles with a size greater than 5 mm.
First stage of the work was aimed at sediment sampling from different areas of the beaches in the south-eastern part of the Baltic Sea to study the quantitative and qualitative composition of the microplastics particles (range 0.5-5 mm) in different seasons. Preference was given to those beaches that are exposed to maximum anthropogenic pollution: areas around the town of Baltiysk, the northern part of the Vistula Spit (near the settlement of Kosa), and the Sambian peninsula coast (settlements of Yantarny, Donskoye, Primorye, Kulikovo, towns of Svetlogorsk, Pionersky, Zelenogradsk) (Fig. 1). During this stage of the study samples were selected from different spots at the beaches (with the highest accumulation of so-called “litter”) – “wracklines”. In these places there is the accumulation of all sorts of objects of different nature and density, which are concentrated in the coastal zone after they have been thrown by sea on the beach. These are typically algae, beach grass, wood chips, branches, charcoal, feathers, shells, amber, paraffin, fish bones, and of course diverse anthropogenic debris (mostly plastic).
From June, 2015 to January, 2016 there were 14 expeditions along the coastline of the Baltic Sea (in Kaliningrad region) to take samples and collect experimental materials. Most parts of the expeditions were carried out after the gale episodes or series of storms. Altogether, 60 sediment samples were collected from thirteen beaches. At each beach, 2-7 positions were randomly selected along “wracklines”, located in several beach zones. Sand samples were collected in a specific areal - a quadrat (0.15 m2) within the top 2 cm of sediment, using a clean stainless steel spatula. Sediment samples were transferred into the polyethylene packages. All sampling locations, sampling dates, sample sediment conditions were recorded.
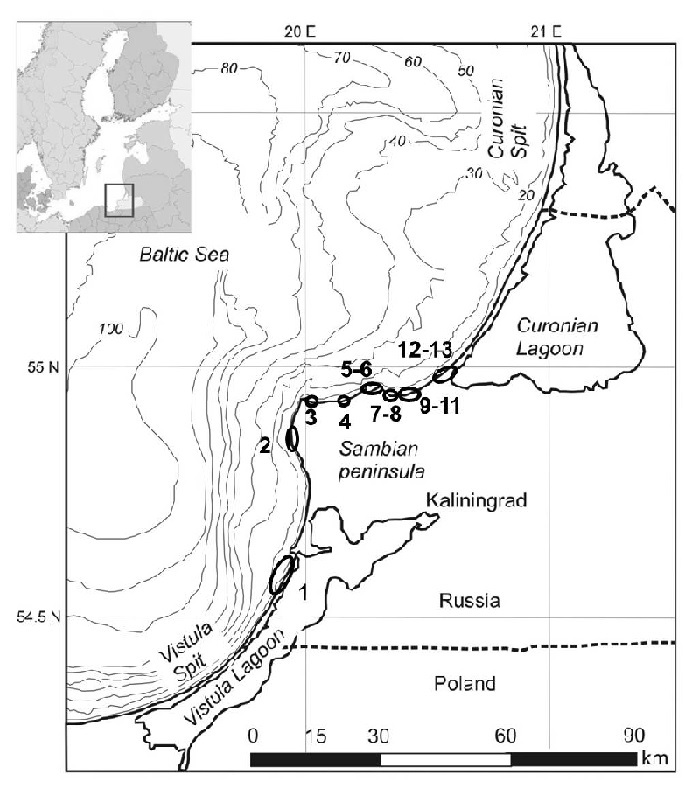
Figure 1. The sampling locations along the coastline of the Baltic Sea (in Kaliningrad region).
In the laboratory, the drying of the collected material happened at ambient conditions. The dried sample was weighed with an accuracy of 0.1 g. All sediments were separated using cascade of three sieves of mesh sizes: 5 mm, 1 mm, 0.5 mm. Materials saved in the sieve were sorted, while those that pass through were discarded. The following types of debris were selected from each site: macro-plastic, microplastics, paraffin and amber (close to plastic in terms of density). Then we weighed all sorted types of “litter”. According to [6, 7, 8, 12], the visual differentiation of microplastic particles from other debris or sand is difficult and only suitable for microplastics ≥1 mm. So, the visual sorting has been used for particles ≥1mm. To separate microplastics from other material in the range 0.5-1 mm the visual inspection under the microscope was used. We used the criteria applied to define a plastic particle in studies of [13, 14] to avoid misidentification of microplastics: (i) no cellular or organic structures are visible, (ii) fibres are equally thick throughout their entire length and should not be tapered at the end, (iii) coloured particles are homogenously coloured, (iv) fibres are not segmented, or appear as twisted flat ribbons, (v) particles are not shiny. These selection criteria are considered applicable only for the microplastic particles within the size range 0.5-5 mm [7, 9]. Visual sampling and sorting of small particles (<0.5-1.0 mm) and visual identification of microplastics are not considered reliable, since particles may be overlooked or wrongly classified as microplastics [8].
At this stage, we accomplished quite a rough estimation of the quantitative composition of microplastics (the visual differentiation of microplastic particles using the microscope) in the explored areas of the beach. For the technical reasons, we did not carry out the density separation of samples using ZnCl2 solution and CaCl solution for separation of unaccounted particles of microplastics (where floating microplastics are picked up from the supernatant). But we plan to do additional processing of all saved sand samples in the range of 0.5-5 mm and to refine the obtained results.
III. Results and discussion
Large amount of debris of various nature was noted on the beach. Macro- and microplastics was found along the coast (from the Vistula Spit to the root of the Curonian Spit) regardless to the proximity of the sampling location to the human settlement area. Various kinds of anthropogenic debris were present even on the quite deserted and remote beaches. From the macro (>25 cm) and mega plastic objects (>1 m) we discovered a large number of plastic bottles, fishing nets, tackle, cables, fragments of boxes, plastic barrels, bags, and pieces of synthetic materials (made of polypropylene, polyethylene, foamed polyethylene, foamed polystyrene, foamed polyurethane, PVC, etc.), pieces of styrofoam, fragments of foamed plastic, reinforced hoses, nets, pieces of insulation, etc. The remnants of debris from earlier buried dumps were located on the slopes of dunes and cliffs.
Also visually we marked colored micro-fragments with size range <5 mm (micro particles) and fragments with larger size range (meso/macro particles >5 mm). Most of them were fragments of cigarette butts and cigarette filters, fishing nets, plastic bottles and plates, polyurethane foam, plastic films, foamed plastic, construction garbage, plastic fragments, granules, synthetic fibers, styrofoam, industrial pellets.
We collected, sifted, sorted, and weighed samples of various kinds of micro and macro particles of plastic, paraffin and amber from 60 beach sediments. We calculated the content of meso/macro plastic, microplastics, paraffin, and amber in the collected samples (percent from the total mass of the sample). Several samples were selected (2-7 points randomly selected) for each location of the beach. The diagrams show the content of meso/macro plastic, microplastics, paraffin, and amber in the collected samples (percent from the total mass of the sample) (Fig. 2). Each legend in Fig. 2 indicates the number of samples (2-7) taken from this location.
It was noted that fragments of dried “tired” meso/macro plastics become brittle. At the screening of the dry brittle material, some fragments broke up to smaller pieces, getting to a different size range - to microplastics. “Tired” plastic is plastic that has been on the beach for a long time and has been exposed to significant influence of the environment, such as: the effect of solar radiation, mechanical abrasion, impact of waves and wind, biofouling, etc. This effect particularly concerns the fragments of disposable dishes (made of polystyrene PS, polystyrene, PP polypropylene), polystyrene films and some types of fibers.
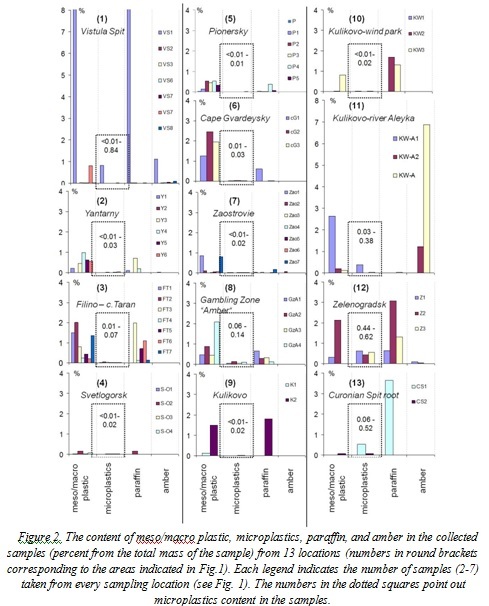
Most meso/macro plastic particles in selected samples (percent from the total mass of the sample) (Fig. 2) was recorded in the following areas (according to Fig. 1): №1 ‒ on the Vistula Spit (8.9%), №11 ‒ between the Kulikovo village and the Aleyka river (2.7%), №6 ‒ at Cape Gvardeysky (2.5%), №8 ‒ in Gambling zone “Amber” (2.1%), №12 ‒ in Zelenogradsk (2.1%), №3 ‒ close to Cape Taran (2%), №9 ‒ in the village of Kulikovo (1.5%). Most microplastics was observed in (Fig. 2): №1 ‒ on the Vistula Spit (0.84%), №12 ‒ in Zelenogradsk (0.44-0.62%), №13 ‒ at the root of the Curonian Spit (0.52%), №11 ‒ between the Kulikovo village and the Aleyka river (0.38%), №8 ‒ in Gambling zone “Amber” (0.14%). We also evaluated the number of paraffin, which congregates well various particles and contaminants of the coast on its surface. Most paraffin was observed in (Fig. 2): №1 ‒ on the Vistula Spit (8.7%), №13 ‒ at the root of the Curonian Spit (3.6%), №12 ‒ in Zelenogradsk (3.1%), №3 ‒ near Cape Taran (2%), №9 ‒ in the village of Kulikovo (1.8%), №10 ‒ near the wind park (1.7%). We marked the presence of amber in samples as well. Most amber in samples was found in: №11 ‒ between the Kulikovo village and the Aleyka river (6.9%), №1 ‒ on the Vistula Spit (1.1%), №12 ‒ in Zelenogradsk (0.1%), №7 ‒ the village of Zaostrovye (0.08%), №2 ‒ in Yantarny (0.01%), №5 ‒ near Pionersky (0.004%).
Baltic amber (density of 1.05-1.09 g/cm3) is within the range of plastics densities (0.05-1.61 g/cm3). Microplastics may behave in the same way as the pieces of amber. Such a comparison of amber with microplastics allows us to use the patterns of behavior of amber in the coastal zone in order to understand the behavior of microplastics.
Beach sediments are moved under the influence of the wind and waves. Wind and wave action leads to breakage of plastic into microparticles. Generation of microparticles occurs on the shoreline during storms. The natural migration of sand during the storm should provide transfer of plastic from beaches to the underwater slope (through the grinding of plastic in the surf zone). This process can occur repeatedly, breaking up large items to smaller and smaller fragments.
Distribution of microplastics along the coast (from point 1 to point 13, according to the map in Fig. 1) in units of milligrams of microplastics per gram of sediment and milligrams of microplastics per m2 are shown in Fig. 3. The figure shows the average and maximum values. Quantity distribution of microplastics in beach sediments (milligrams per gram of sediment and milligrams per m2) with the average values with an error of random measurements, maximum and minimum values are shown accordingly in Table 1. Presentation of the obtained results in these units corresponds to the results of some studies [7, 15].
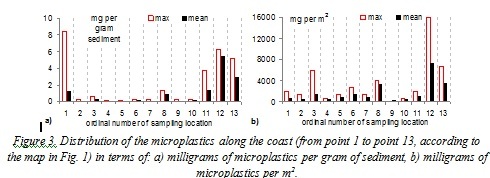
Table 1. Measured microplastics quantities in beach sediments
|
ordinal number of sampling location |
|
mg per gram of |
mg per m2 |
|
1 |
Mean ± Δ |
1.23±2.92 |
690±590 |
|
Min.–max. |
6.80·10-3−8.38 |
67−2000 |
|
|
2 |
Mean ± Δ |
0.10±0.10 |
580±500 |
|
Min.–max. |
5.17·10-3−0.25 |
67−1333 |
|
|
3 |
Mean ± Δ |
0.23±0.20 |
1520±1840 |
|
Min.–max. |
0.09−0.67 |
666−6000 |
|
|
4 |
Mean ± Δ |
0.11±0.11 |
520±480 |
|
Min.–max. |
0.01−0.17 |
67−667 |
|
|
5 |
Mean ± Δ |
0.05±0.02 |
780±280 |
|
Min.–max. |
0.04−0.08 |
667−1333 |
|
|
6 |
Mean ± Δ |
0.20±0.16 |
1560±2530 |
|
Min.–max. |
0.14−0.27 |
667−2667 |
|
|
7 |
Mean ± Δ |
0.12±0.06 |
870±450 |
|
Min.–max. |
7.83·10-3−0.22 |
67−1333 |
|
|
8 |
Mean ± Δ |
0.92±0.60 |
3330±870 |
|
Min.–max. |
0.58−1.38 |
4000−2667 |
|
|
9 |
Mean ± Δ |
0.11±0.43 |
370±1290 |
|
Min.–max. |
0.01−0.21 |
67−667 |
|
|
10 |
Mean ± Δ |
0.14±0.28 |
460±860 |
|
Min.–max. |
0.02−0.24 |
67−667 |
|
|
11 |
Mean ± Δ |
1.44±5.04 |
1130±2440 |
|
Min.–max. |
0.20−3.78 |
67−2000 |
|
|
12 |
Mean ± Δ |
5.42±2.27 |
7330±18800 |
|
Min.–max. |
4.4−6.2 |
2000−16000 |
|
|
13 |
Mean ± Δ |
2.89±9.94 |
3660±12900 |
|
Min.–max. |
0.58−5.20 |
667−6667 |
Microplastics were found in all 60 beach sediment samples. Figures for each location are given within a range, because maximum and minimum densities were consistently found in different points on the beaches (Table 1). Most of the plastic particles were found near the popular recreation areas. But probably the action of sea and strong gales is the main explanation for the greater density along beaches.
Examples of detected particles of meso- and microplastics are shown in Fig. 4: polyurethane foam, plastic films, foamed plastic, plastic fragments, granules, synthetic fibers, styrofoam, industrial pellets, as well as pieces of paraffin and amber.
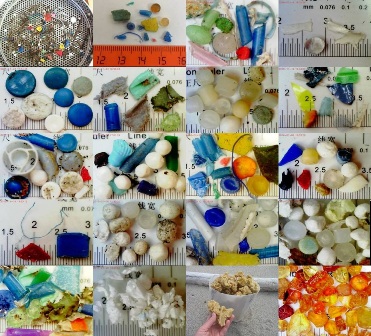
Figure 4. Beach samples of the micro- and mesoplastic particles: plastic fragments, industrial pellets, beads, fibres, plastic films, foamed plastic, granules, styrofoam, as well as paraffin that accumulates multiple pieces of everything in question, and amber (photos by Esiukova Elena).
IV. Conclusions
Micro-sized primary plastic litter from consumer products with degraded secondary micro-fragments leads to an increasing amount of small plastic particles on the beach. There are a great number of sources of primary and secondary microplastics in the environment (widespread consumer plastic products, plastic fragments, fishing nets, raw industrial pellets, etc. [1, 7, 16]). Abrasion and fragmentation of larger plastic items and of materials containing synthetic polymers is very relevant.
After the storm events the concentration of plastic on the beach along “wracklines” is increased. We noted that there is an unevenness of distribution and heterogeneity of plastic fragments along the coast of the south-eastern Baltic (in Kaliningrad region).
- Microplastics (0.5-5 mm) in samples taken from the top 2 cm of sandy beach make from <0.01% to 0.84% of the total sample’s mass. The areas of the Vistula Spit (0.84%), Zelenogradsk (0.44-0.62%), the root of the Curonian Spit (0.52%), between the village of Kulikovo and the Aleyka river (0.38%), in Gambling zone “Amber” (0.14%) revealed its highest concentrations.
- Measured microplastics densities in beach sediments on average (with an error of random measurements) are from 370±1290 to 7330±18800 (mg per m2), and from 0.05±0.02 to 2.89±9.94 (mg per gram of sediment).
- Macro- and mesoplastics were found all along the coastline of the Baltic Sea (in Kaliningrad region) (from 0.01% to 8.94% of the total sample mass).
- Paraffin in the samples makes up to 8.7%. Highest concentrations were found in the areas of the Vistula Spit (8.7%), the root of the Curonian Spit (3.6%), Zelenogradsk (3.1%), near Cape Taran (2%), the village of Kulikovo (1.8%) and near the wind park (1.7%).
- Small fractions of amber (mainly 0.5-2 mm) were detected in the samples at low concentrations (<0.01%). The exceptions were samples taken after heavy storms in the area of Kulikovo and the Vistula Spit (coarse fractions up to 1-3 cm) in the “wracklines” area.
- The greatest number of the micro-, meso-, and macroplastics was found in the band “wracklines” and under the foredune ridge.
Beaches are dynamic systems, so probably microplastics may become buried in deeper sediment layers during periods of accumulation of additional matter [7]. This should be further examined with stratified samples using cores [17, 18, 19].
The research is supported by the Russian Science Foundation grant number 15-17-10020.
1. M. Bergmann, L. Gutow, M. Klages (Eds.). Marine Anthropogenic Litter, Springer, 447 p, ISBN 978-3-319-16509-7 ISBN 978-3-319-16510-3 (eBook) DOIhttps://doi.org/10.1007/978-3-319-16510-3, 2015.
2. T. Rocha-Santos, A.C. Duarte, “A critical overview of the analytical approaches to the occurrence, the fate and the behavior of microplastics in the environment,” TrAC Trends in Analytical Chemistry, vol. 65, pp. 47-53, 2015.
3. M. Cole, P. Lindeque, C. Halsband, T.S. Galloway, “Microplastics as contaminants in the marine environment: A review,” Marine Pollution Bulletin, vol. 62. pp. 2588-2597, 2011.
4. P. Sundt, P-E. Schulze, F. Syversen, “Sources of microplastic-pollution to the marine environment,” Report no M-321/2015, Asker: Mepex Consult, 2014.
5. GESAMP, “Sources, fate and effects of microplastics in the marine environment: a global assessment,” (P.J. Kershaw, eds.), (IMO/FAO/UNESCO-IOC/UNIDO/WMO/IAEA/UN/UNEP/UNDP Joint Group of Experts on the Scientific Aspects of Marine Environmental Protection), Rep. Stud. GESAMP, No. 90, 2015.
6. European Commission, “Guidance on monitoring of marine litter in European seas. A guidance document within the common implementation strategy for the Marine Strategy Framework Directive,” Ispra: European Commission, Joint Research Centre, MSFD Technical Subgroup on Marine Litter, 2013.
7. V. Hidalgo-Ruz, L. Gutow, R.C. Thompson, M. Thiel, “Microplastics in the marine environment: a review of the methods used for identification and quantification,” Environ. Sci. Technol., vol. 46. pp. 3060-3075, 2012.
8. K. Duis, A. Coors, “Microplastics in the aquatic and terrestrial environment: sources (with a specific focus on personal care products), fate and effects,” Environ. Sci. Eur., vol. 28:2 DOIhttps://doi.org/10.1186/s12302-015-0069-y, 2016.
9. M.F. Costa, J.A. Ivar do Sul, J.S. Silva-Cavalcanti, M.C.B. Araújo, A. Spengler, P.S. Tourinho, “On the importance of size of plastic fragments and pellets on the strandline: a snapshot of a Brazilian beach,” Environ. Monit. Assess., vol. 168. pp. 299-304, 2010.
10. S.L. Wright, R.C. Thompson, T.S. Galloway, “The physical impacts of microplastics on marine organisms: A review,” Environ. Pollut., vol. 178. pp. 483-492, 2013.
11. I. Chubarenko, A. Bagaiev, M. Zobkov, E. Esiukova, “On some physical and dynamical properties of microplastic particles in marine environment,” Marine Pollution Bulletin, DOI:https://doi.org/10.1016/j.marpolbul.2016.04.048, 2016.
12. Y.K. Song, S.H. Hong, M. Jang, G.M. Han, M. Rani, J. Lee, W.J. Shim “A comparison of microscopic and spectroscopic identification methods for analysis of microplastic in environmental samples,” Marine Pollution Bulletinvol, vol. 93(1-2), pp. 202-209. doi: 10.1016/, 2015.
13. F. Norén, “Small plastic particles in Coastal Swedish waters,” KIMO report, 2007.
14. N.H.M. Nor, J.P. Obbard, “Microplastics in Singapore’s coastal mangrove ecosystems,” Marine Pollution Bulletin, vol. 79. pp. 278-283, 2014.
15. F. Faure, C. Demars, O. Wieser, M. Kunz, L. de Alencastro, “Plastic pollution in Swiss surface waters: nature and concentrations, interaction with pollutants,” Environ. Chem., http://dx.doi.org/10.1071/EN14218, 2015.
16. A.L. Andrady, “Microplastics in the marine environment,” Marine Pollution Bulletin, vol. 62. pp. 1596-1605, 2011.
17. J. Martins, P. Sobral, “Plastic marine debris on the Portuguese coastline: A matter of size?” Marine Pollution Bulletin, vol. 62, pp. 2649-2653, 2011.
18. H.S. Carson, S.L. Colbert, M.J. Kaylor, K.J. McDermid, “Small plastic debris changes water movement and heat transfer through beach sediments.” Marine Pollution Bulletin, vol. 62, pp. 1708-1713, 2011.
19. A. Turra, A. Manzano, R. Dias, M. Mahiques, L. Barbosa, D. Balthazar-Silva and F. Moreira, “Three-dimensional distribution of plastic pellets in sandy beaches: shifting paradigms,” Scientific Reports, vol. 4: 4435, DOI:https://doi.org/10.1038/srep04435, 2014.