


BISAC NAT010000 Ecology
BISAC NAT045050 Ecosystems & Habitats / Coastal Regions & Shorelines
BISAC NAT025000 Ecosystems & Habitats / Oceans & Seas
BISAC NAT045030 Ecosystems & Habitats / Polar Regions
BISAC SCI081000 Earth Sciences / Hydrology
BISAC SCI092000 Global Warming & Climate Change
BISAC SCI020000 Life Sciences / Ecology
BISAC SCI039000 Life Sciences / Marine Biology
BISAC SOC053000 Regional Studies
BISAC TEC060000 Marine & Naval
Vistula Lagoon as a part of the coastal zone translates nutrient load from catchment to the Baltic Sea. Catchments of the Primorskaya River (small settlements, mostly agricultural area, 120 km2) and Banówka-Mamonovka River (transboundary catchment between Russia and Poland, relatively big settlements, food production enterprises, agricultural activity, 490 km2) were selected as test ones for the Vistula Lagoon catchment (23 870 km2). Assessment of the retention of total nitrogen and phosphorus in the catchment and the transformation of nutrient load from anthropogenic sources while passing the catchment were studied by using open source numerical modeling tools. Initial data comprises the geomorphic characteristics, river net data, information on land use and nutrient point sources, time series of temperature, precipitation. Runoff was simulated by hydrological model HYPE considering the evaporation and infiltration into the soil. Retention and transport of nutrients were accessed using the model FyrisNP. Source apportionment was made for the nutrient load discharging from both catchments to the Vistula Lagoon. The greatest amount of nutrients in final discharge is coming from the arable land (50-80%), point sources constitute a smaller proportion (5-30%). The results will be used to obtain the first order approximation of the nutrient load from other small rivers of the Vistula Lagoon catchment and from the biggest river in the area, the Pregolya River (15 300 km2) by analogy.
mathematical modeling, catchment, nutrient load, Vistula Lagoon
I. Introduction
Eutrophication is one among four main problems of the Baltic Sea (State and Evolution of the Baltic Sea, 2008). HELCOM Baltic Sea Action Plan (HELCOM BSAP, 2007) adopted in 2007 recommends the measures on nutrient load reduction. According to national quotas (Copenhagen Ministerial Declaration, 2013) the load from Kaliningrad Oblast has to be reduced by 50% of phosphorus and 25% on nitrogen comparing with nowadays level (HELCOM Summary report…, 2013). Points and diffuse sources are rather dispersed. The first-order approach to distribute quotas within the territory of the Kaliningrad Oblast is to make it in proportion to the area of sub-catchments of all rivers. The next step is to apply numerical modeling tool to simulate the retention of the nutrients within the catchment. The present paper is devoted to application of the numerical model to pilot catchments of the Banówka-Mamonovka River and the Primorskaya River. The catchments of these rivers cover 3% of the Vistula Lagoon Catchment.
II. Materials and methods
Study area
The Banówka-Mamonovka River catchment is a transboundary catchment between Russia and Poland. The main stream starts on the territory of Poland (here called the Banówka River) and runs into the Vistula Lagoon of the Baltic Sea through the Kaliningrad Oblast of Russia (fig. 1). The stream of the river at the Kaliningrad Oblast is called Mamonovka, referencing the town of Mamonovo. The catchment area is 350 km2. 140 km2 of it is located in the south-western part of the Kaliningrad Oblast, and 210 km2 in the northern part of the Warmia and Masury Voivodeship of Poland. The Mamonovka River has a great number of tributaries. The largest tributaries are the Ignatievka (eastern) and the Vitushka (western). The width of the stream at the outlet is 10-16 meters.
The catchment of the Primorskaya River (120 km2) is located on the Sambian Peninsula in the western part of the Kaliningrad Oblast. The length of the main stream is about 30 km. The river flows in the Promorsk Bay of the Vistula Lagoon.
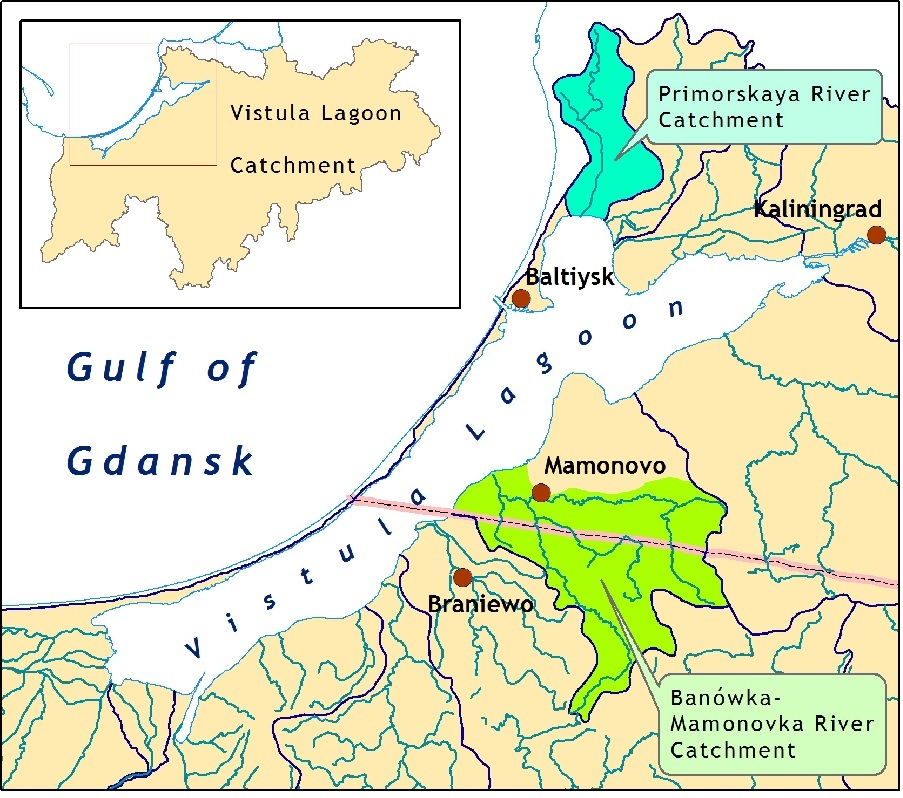
Fig. 1. Locations of Banówka-Mamonovka and Primorskaya Rivers Catchments.
Modeling tools
Two models were used to simulate water quality and determine the proportions between the components of the nutrient loads (from agriculture, point sources, background, etc.): hydrological model HYPE (developed by Swedish Meteorological and Hydrological Institute) and model for nutrient load assessment FyrisNP (developed by Swedish University of Agricultural Sciences).
The HYPE model estimates time dependence of the daily runoff rate at final cross-sections of the sub-basins system taking into account evaporation and seepage in soils. The input data includes information about the relief, land use structure, soil types, daily time-series of precipitation and air temperature. For the purpose of calibration, runoff time-series are required at monitoring points within the catchment. Model files contain information about boundary conditions according to temperature and the amount of precipitation fallen as well as data on water discharge at a final cross-section and catchment area parameters (Donnelly et. all, 2010).
The dynamic FyrisNP model calculates source apportioned gross and net transport of nitrogen and phosphorus in rivers and lakes. The main scope of the model is to assess the effects of different nutrient reduction measures on the catchment scale. The time step for the model is in the majority of applications one month and the spatial resolution is on the sub-catchment level. Retention, i.e. losses of nutrients in rivers and lakes through sedimentation, up-take by plants and denitrification, is calculated as a function of water temperature, nutrients concentrations, water flow, lake surface area and stream surface area. Data used for calibrating and running the model can be divided into time dependent data, e.g. time series on observed nitrogen and phosphorus concentration, water temperature, runoff and point source discharges, and time independent data, e.g. landuse information, lake area and stream length and width (Hansson at all, 2008).
Input data and calibration
Input data for temperature and precipitation were taken from two meteorological stations among 4 existing in the Kaliningrad Oblast (using open access archive RP5.RU), namely, Mamonovo station for the Banówka-Mamonovka catchment and Kaliningrad station for the Primorskaya catchment. Calibration of the HYPE model (hydrological level) were made by daily measurements, calibration of the FyrisNP model was made by seasonal data on nutrient concentrations. The Mamonovka River sampling point (hydrological and nutrient measurements) is located 7 km upstream the mouth of the on the Banówka-Mamonovka River. The Primorsk sampling point (hydrological and nutrient measurements) is located 1.5 km upstream the mouth of the Primorskaya River. Modeling periods were 2007-2011 and 2010-2014 for the Banówka-Mamonovka and Primorskaya catchments respectively.
Input nutrient load data
Only settlements located in the catchments areas, as well as a fur-farm in the Russian part of the catchment area are regarded as point sources of pollution. Due to difficulties to collect data for all water users, the amount of total nitrogen and phosphorus per person (or per animal) per year was evaluated by means of calculation (Gorbunova, Chubarenko, 2009). Settlements in the rural areas of the Kaliningrad Oblast have no complete treatment systems (Treatment facilities, Velikanov, Proskurin, 2003) and waste water flowing into surface waters were considered as untreated.
Regional statistic data were used to estimate the nutrients load from the population living in sub-catchments. It was assumed that each inhabitant connected to the sewage system produces
Number of livestock is an important indicator of the agricultural impact on the environment. In recent years the performance of the agricultural sector in the basin has decreased including the areas for crop, livestock population and animal production for both tenant farmer and owner-operated farms. Therefore, agriculture lands on the Russian part of the catchment of the Banówka-Mamonovka River were considered as temporarily underutilized lands (‘Open’). For the Primorskaya River catchment potentially agricultural land was partly assigned as “Open” (59%), and partly as ‘Arable’ (8%) (those we definitely knew that agricultural activity exists). For the Polish part of the basin, land use structure was defined according to the European Programme “Corine Land Cover” (CLC, 2000) for 2005. Information on type specific concentrations of nutrients for different land uses were applied, the values of type specific concentrations were taken as for south-eastern lands of
III. Results OF CALIBRATION AND VERIFICATION
Delineation into sub-catchments
For the purpose of modeling the Banówka-Mamonovka catchment was divided into 10 sub-catchments:
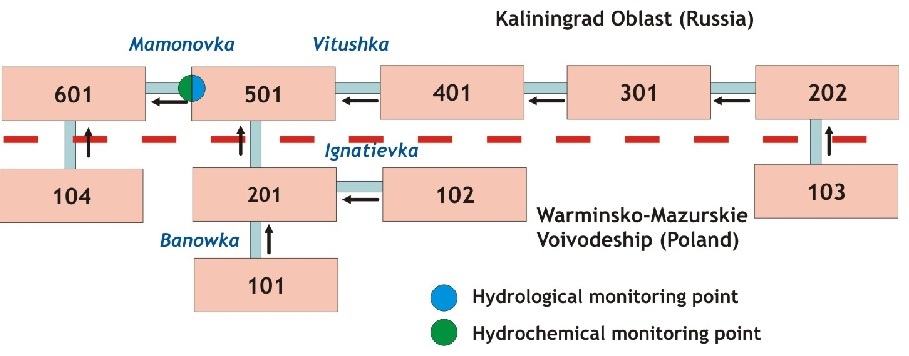
Fig. 2. Sub-catchments delineation scheme for the Banówka-Mamonovka River catchment. Dashed line illustrates the state border between Poland and Russia.
The Primorskaya River catchment (120 km2) was subdivided into 15 sub-basins. (Figure 3). The areas of these sub-basins were in the range of 1.5 - 19 km2. Monitoring point located in the sub-basin ID 761 was used. This point was further upstream the area of backwards stream in the mouth. There are 3 sub-basins (ID 717, 718 и 771) are downstream the monitoring point.
Hydrological modeling
The hydrological HYPE model (HYdrological Predictions for the Environment) (E-HYPE) was used to obtain data concerning the water discharge rate in the territory of each sub-basin. (Donnelly et. all, 2010). The typical error of the discharge projections is about ±10% calculated on a long term average and compared to the observations. When it comes to individual daily values the number of errors increases, and the same happens when you get down to small areas.
An optimal set of parameters was created with the use of the expert method, by trial and error according to the observation data at the monitoring point. These parameters allowed approximating the curve of the model discharge to the curve of the measured runoff. It turned out that modeling depends mostly on change of parameters influencing evaporation from the catchment area.
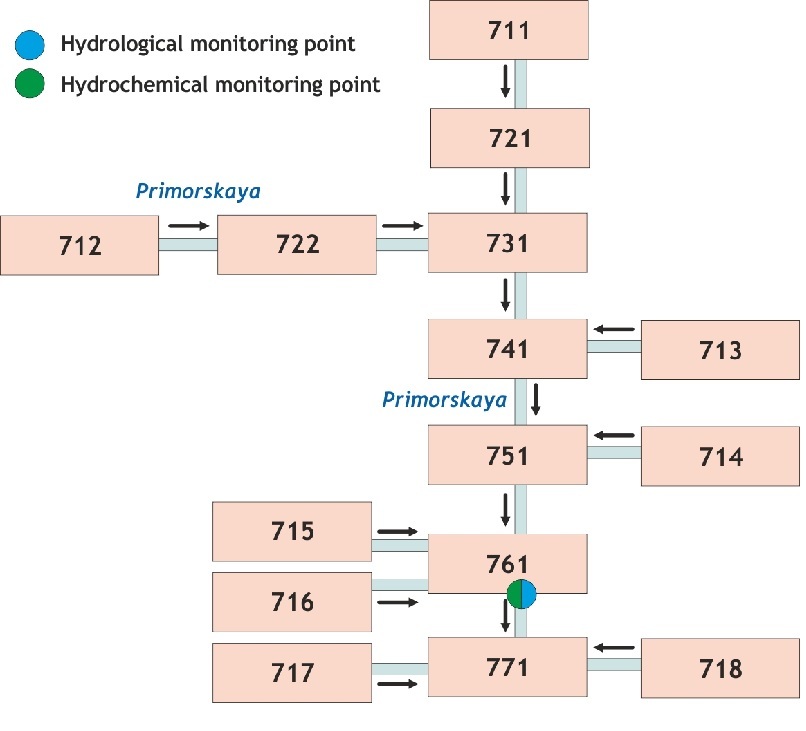
Fig. 3. Sub-catchments delineation scheme for the Primorskaya River catchment.
The period 2008-2010 was chosen as a calibration of water discharge for the Banówka-Mamonovka River catchment. The correlation coefficient (R) between measured and simulated discharges at the final cross section of the sub-basin 501 (Mamonovo demarcated site) was 0.93. Average measured discharge is 4.3 m3/sec, the simulated one – 4.4 m3/sec. (Table 1).
Table 1. Mean, maximum and minimum discharge for the Banówka-Mamonovka River, obtained by measurements and calibration simulations by the HYPE model (2008-2010).
|
Time-series |
Mean km3/year |
Mean (m3/sec) |
Maximum (m3/sec) |
Minimum (m3/sec) |
|
Results of model calibration |
||||
|
Measured data |
0.14 |
4.3 |
12.7 |
1.2 |
|
Simulated data, 2008-2010 |
0.14 |
4.4 |
14.0 |
0.8 |
|
Results of model verification |
||||
|
Measured data |
0.14 |
4.3 |
6.2 |
2.3 |
|
Simulated data, 2011 |
0.13 |
4.0 |
8.2 |
1.2 |
The runoff for 2011 was chosen as a verification set of data for the Banówka-Mamonovka. The result was little worse than for calibration, correlation coefficient was 0.86. Taking into consideration short calibration period, the data for 2011 were also included into calibration data set and new set of calibration parameters for HYPE model was adopted. The resulted time series of simulated and measured discharge for four years (2008-2011) are presented on Figure 4 for expert judgment.
The correlation between measured and simulated discharge for the Primorskaya River for the period of 20101-2013 was 0.88 (final cross-section of the sub-catchment ID 761. Mean water discharge over the whole period was 1.3 m3/sec obtained by measurements and 1.2 m3/sec obtained by modeling (see Table 2).
The data for 2014 were taken as verification data set for the Primorskaya River. The result was better than for calibration period, the correlation coefficient was 0.94. Modelled runoff of each of the sub-basin were used for the next step – the modeling the nutrient load from the catchments.
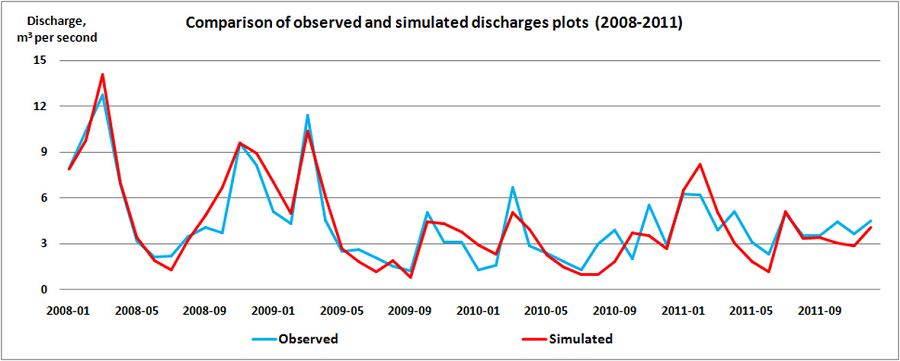
Figure 4. Variations of the Banówka-Mamonovka River discharge at the Mamonovo monitoring station during 2008-2011.
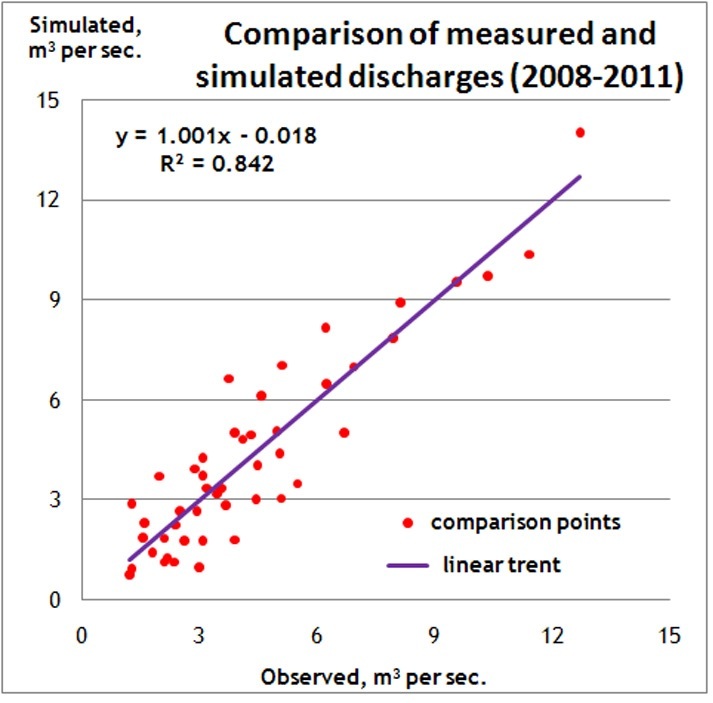
Figure 5. Linear regression between measured and simulated discharges (2008-2011) of the Banówka-Mamonovka River.
Table 2. Mean, maximum and minimum discharge for the Primorskaya River, obtained by measurements and calibration simulations by the HYPE model (2010-2014).
|
Time-series |
Mean km3/year |
Mean (m3/sec) |
Maximum (m3/sec) |
Minimum (m3/sec) |
|
Results of model calibration |
||||
|
Measured data |
0.04 |
1.3 |
4.1 |
0.1 |
|
Simulated data, 2010-2013 |
0.04 |
1.2 |
8.5 |
0.2 |
|
Results of model verification |
||||
|
Measured data |
0.6 |
0.02 |
2.1 |
0.1 |
|
Simulated data, 2014 |
0.6 |
0.02 |
4.0 |
0.1 |
Modeling of nutrient transport
FyrisNP model has two calibration parameters, namely: c0[dimensionless], an empirical calibration parameter, determines how much the retention is reduced by temperature in a range of 0°-20°C; and kvs [LT-1], an empirical calibration parameter for the flow rate adjustment factor.
FyrisNP provides two methods of calibration, the one by using Monte Carlo statistical estimation and the second – by automatic calibration. The first one gave better results for the phosphorus simulations, the second one – for the nitrogen.
.jpg)
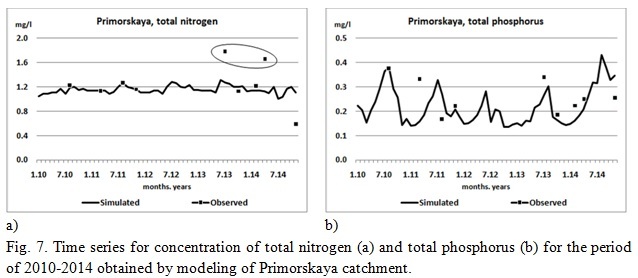
Table 3. Mean concentration of total nitrogen and phosphorus for the Banówka-Mamonovka and Primorskaya Rivers obtained by measurements and simulations by the FyrisNP model.
|
River |
Total nitrogen |
Total phosphorus |
||
|
Observed value (mg/l) |
Simulated value (mg/l) |
Observed value (mg/l) |
Simulated value (mg/l) |
|
|
Banówka-Mamonovka (2008-2011) |
2.22 |
2.33 |
0.138 |
0.140 |
|
Primorskaya (2010-2014) |
1.24 |
1.15 |
0.26 |
0.22 |
Results of calibration in terms of modeled time series of nutrients concentrations (mg per liter) against the measured values are presented on the Figure 6 and 7. Temporal variations of nitrogen and phosphorus are presented for the monitoring points: the Banówka-Mamonovka River during 4 years (2008-2011) on the Figure 6, and the Primorskaya River during 5 years (2010-2014) on the Figure 7. Even details of temporal variations are not well described by model, the general level of concentrations with some seasonal variations are resolved, and mean values for the whole period of calibration are in good agreement (Table 3).
The fact that there is no single set of calibration parameters for both catchments, the Banówka-Mamonovka River and Primorskaya River, despite their similarity, means that uncertainties originated from spatial data, precipitation, and data on nutrient load within the catchment are still high, and the models of nutrient assessment should be tuned for each catchment specifically.
IV. Discussion of the source apPortionment results
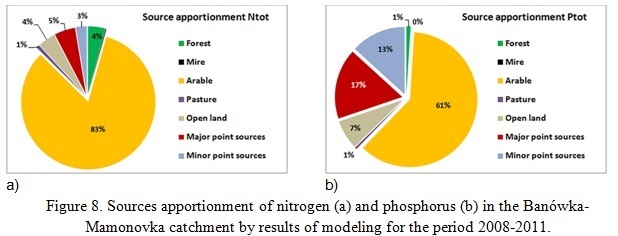
The average annual removal of total nitrogen from the Banówka-Mamonovka River catchment area to the Vistula Lagoon was of 400 tons per year for the period of 2008-2011. And the removal of total phosphorus from the catchment area was 25 tons per year. The retention in the catchment was estimated as 20% for the total nitrogen and 31% for the total phosphorus.
The nitrogen and phosphorus load source apportionment is presented in Figure 8. The load from an arable lands is the most significant portion (82% for the nitrogen and 61% for the phosphorus).
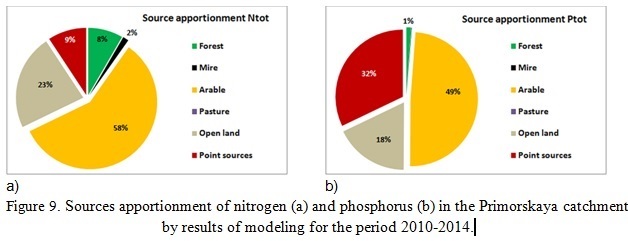
For the Primorskaya River catchment the average annual removal was estimated as 43 tons of total nitrogen and 6.2 tons of total phosphorus per year for the period of 2010-2014. On average the retention for the catchment was only 8% for the nitrogen and 2% for the phosphorus.
Despite the arable land not occupying the main part of the catchment area, its input in the final release of nutrients from the catchment is rather high - 58% for the nitrogen and 49% for the phosphorus (Figure 9). Open lands occupy about 60% of catchment area, but give 23% of the total nitrogen and 18% of the total phosphorus. The same for the forests and mires, the portion of nutrients they are cause, 8% and 2% of nitrogen and 1% and 0.15 of phosphorus, rather less than the portion of area they occupy. The point sources are one of the most significant nutrient source, they produce 9% of nitrogen and 32% of phosphorus.
V. Conclusive REMARKS
The main sources of uncertainty in the model results for catchment of the Kaliningrad Oblast are an area specific data on agricultural practice and fertilization, initial data for calibration (monitoring data), as well as information on time specific concentrations for soils. The temporal frequency of the nutrient monitoring data (today it is once per season) should be increasedto reproduce seasonal variations of the processes. Nowadays state monitoring program doesn’t include laboratory analysis on total nitrogen and phosphorus, and only covers ordinary inorganic forms of them (nitrate, nitrite, ammonia, phosphate), while for correct modeling the total nitrogen and phosphorus (inorganic and organic forms) are essential. Time specific concentrations for different types of soils in the Kaliningrad Oblast never were estimated.
Well calibrated hydrological model ensures the correct estimation of total nutrient removal for several years period despite all uncertainties in modeling of nutrient concentrations.
Existed network of meteorological stations in the Kaliningrad Oblast (1 station per 3500 km2 in average) is very poor to cover spatial variations in atmospheric parameters, especially in rainfall. Re-analysis data (1 point per 1000 km2) were used for modeling.
The application of numerical model calibrated for 4 years for the Banówka-Mamonovka (2008-2011) and 5 years for the Primorskaya River (2010-2014) gave the estimation that the Banówka-Mamonovka river catchment (350 km2) and the Primorskaya River catchment (120 km2) give average annual removal of 400 and 43 ton of total nitrogen and 25 and 6.2 ton of total phosphorus per year. The retention characteristics in these sub-catchments were estimated as 20% and 8% for nitrogen and 31% and 2% for phosphorus respectively.
Obtained results showed that zero-level estimation of load using proportions of different land use in the area of catchment is too much uncertain. There are no alternative to model tool application (even the simplest one) to estimate the nutrient removal from catchment areas as many processes (some of them fully nonlinear) should be taken into consideration.
Acknowledgement
Simulations for the Banówka-Mamonovka basin were made within the Project BaltHazAR Phase II (“Building capacity within environmental monitoring to produce pollution load data from different sources for e.g. HELCOM pollution load compilations”), simulations for the Primorskaya basin were made within grant RFBR-Bonus 14-05-9173015 "Reducing nutrient loadings from agricultural soils to the Baltic Sea via groundwater and streams (Soils2Sea)".
1. Corine Land Cover technical guide - Addendum 2000 / Prepared by M.Bossard, J.Feranec, J. Otahel - Published European Environment Agency, 2000, 104 P.
2. Donnelly, C., Dahné. J., Rosberg, J., Strömqvist, J., Yang, W. and Arheimer, B. (2010) High-resolution, large-scale hydrological modelling tools for Europe. Proc. of the Sixth World FRIEND Conference, Fez, Morocco, October 2010). IAHS Publ. 340, 2010.
3. E-HYPE: HYdrological Predictions for the Environment - Europe, URL: http://www.smhi.se/en/Research/Research-departments/Hydrology/hype-in-europe-e-hype-1.7892 (date of last use is 15.05.2016)
4. Gorbunova J., Chubarenko B., Source apportionment modelling of nutrient transport in Instruch River Basin in Kaliningrad Oblast (Russia). Final Report of the Project within the Agreement No HarmoBalt-Kld, Kaliningrad, 2009
5. Hansson K., Wallin M., Djodjic F., Orback C. The FyrisNP model Version 3.1 - A tool for catchment-scale modelling of source apportioned gross and net transport of nitrogen and phosphorus in rivers. A users manual. Uppsala: Dept. of Aquatic Science and Assessment 2008. - 28 p.
6. HELCOM Baltic Sea Action Plan. Krakow, 2007 101 P.
7. HELCOM Copenhagen Ministerial Declaration. Copenhagen, 2013. 19 P.
8. RP5.RU: Archive of weather for Mamonovo. time-table http://rp5.ru/5193/ru (date of last use is 08.06.2012)
9. State and Evolution of the Baltic Sea, 1952-2005: A Detailed 50-Year Survey of Meteorology and Climate, Physics, Chemistry, Biology, and Marine Environment / Ed. R. Feistel, G.Nausch, N. Wasmund. 2008. ISBN: 9780471979685
10. Summary report on the development of revised Maximum Allowable Inputs (MAI) and updated Country Allocated Reduction Targets of the Baltic Sea Action Plan, 2013. 22 P.
11. Swedish Environmental Protection Agency: What does domestic wastewater contain? Swedish EPA Report 4425. 1995
12. Treatment facilities. WEB source: http://www.stroyint.ru/polezinfo/monitoring/ index.php?ELEMENT_ID=574 (in Russian, date of last use is 08.06.2012)
13. Velicanov N. Proskursnin E. Kaliningrad Oblast: Peculiarities of water recourses us-ing. Kaliningrad: Publisher “Yantarny Skaz”, 2003. - 128 p. Original source: Velikanov N.L., Proskurnin E.D. Kaliningradskaya oblast': Osobennosti ispol'zovaniya vodnyh resursov. - Kaliningrad: FGUIPP «Yantarnyy skaz», 2003. - 128 c.